-
-
1
multi-directional
earth sampling -
2
deep (and shallow)
earth sampling -
3
uniformly dense
earth sampling -
4
complete conductive-resistive
spectrum coverage -
5
objective bad-data
trapping -
Comments
1: MULTI-DIRECTIONAL EARTH SAMPLING
Will your survey cover all possibly relevant orientations?
Main fault or cross-breaking fault... Choose only one?
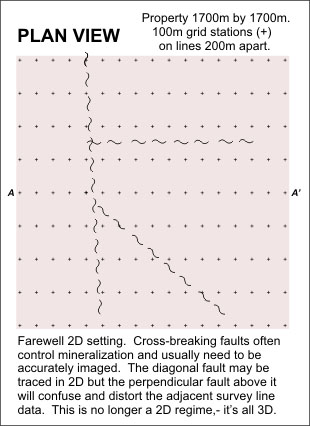
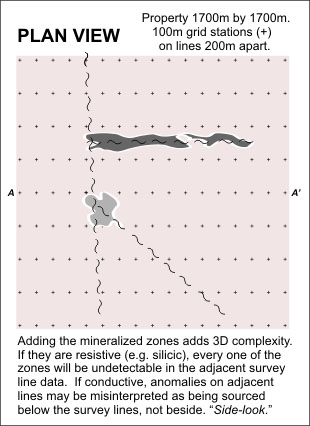
With this simple decision, the information to be gained from the survey has been cut substantially, -
a whole range of other possible orientations of features has been abandoned... though their unknown
presence may yet be felt as they influence and distort the survey's one-directional data measurements.
Sometimes explorationists have run two separate surveys, one oriented 90 degrees to the other, to make sure all orientations have been covered. This is hardly a cost-effective solution for routine surveys in unknown conditions. Well, you might say, why not survey in all of the directions, while we're out there? Why not indeed?
Sometimes explorationists have run two separate surveys, one oriented 90 degrees to the other, to make sure all orientations have been covered. This is hardly a cost-effective solution for routine surveys in unknown conditions. Well, you might say, why not survey in all of the directions, while we're out there? Why not indeed?
How did we end up with survey lines oriented east-west as in the above images?
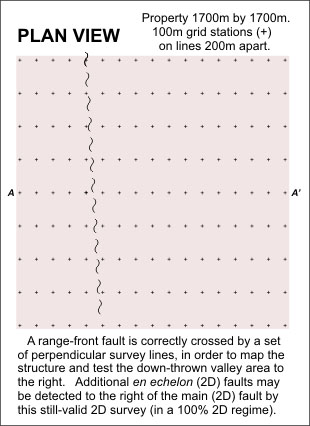
In conventional collinear array resistivity surveys, linear structures or features that are crossed at a high angle have a good chance of being recognized, while parallel features do not. Explorationists are required to choose which orientation is thought to be most significant, in advance of any survey feedback, simply in order to plan where to put the survey lines. The choice here was to maintain ability to recognize the north-south (rangefront?) main faults and forego sensitivity to any cross-breaking oriented structure (and anomalies).
In conventional collinear array resistivity surveys, linear structures or features that are crossed at a high angle have a good chance of being recognized, while parallel features do not. Explorationists are required to choose which orientation is thought to be most significant, in advance of any survey feedback, simply in order to plan where to put the survey lines. The choice here was to maintain ability to recognize the north-south (rangefront?) main faults and forego sensitivity to any cross-breaking oriented structure (and anomalies).
2. DEEP (and shallow) EARTH SAMPLING
Does your survey go deep enough so that your target anomaly
will be properly constrained,- cut off - on its lower edge?
Will it even reach the target depth you have in mind?
Only a sufficient extra depth of measured data will allow a reliable interpretation one way or the other.
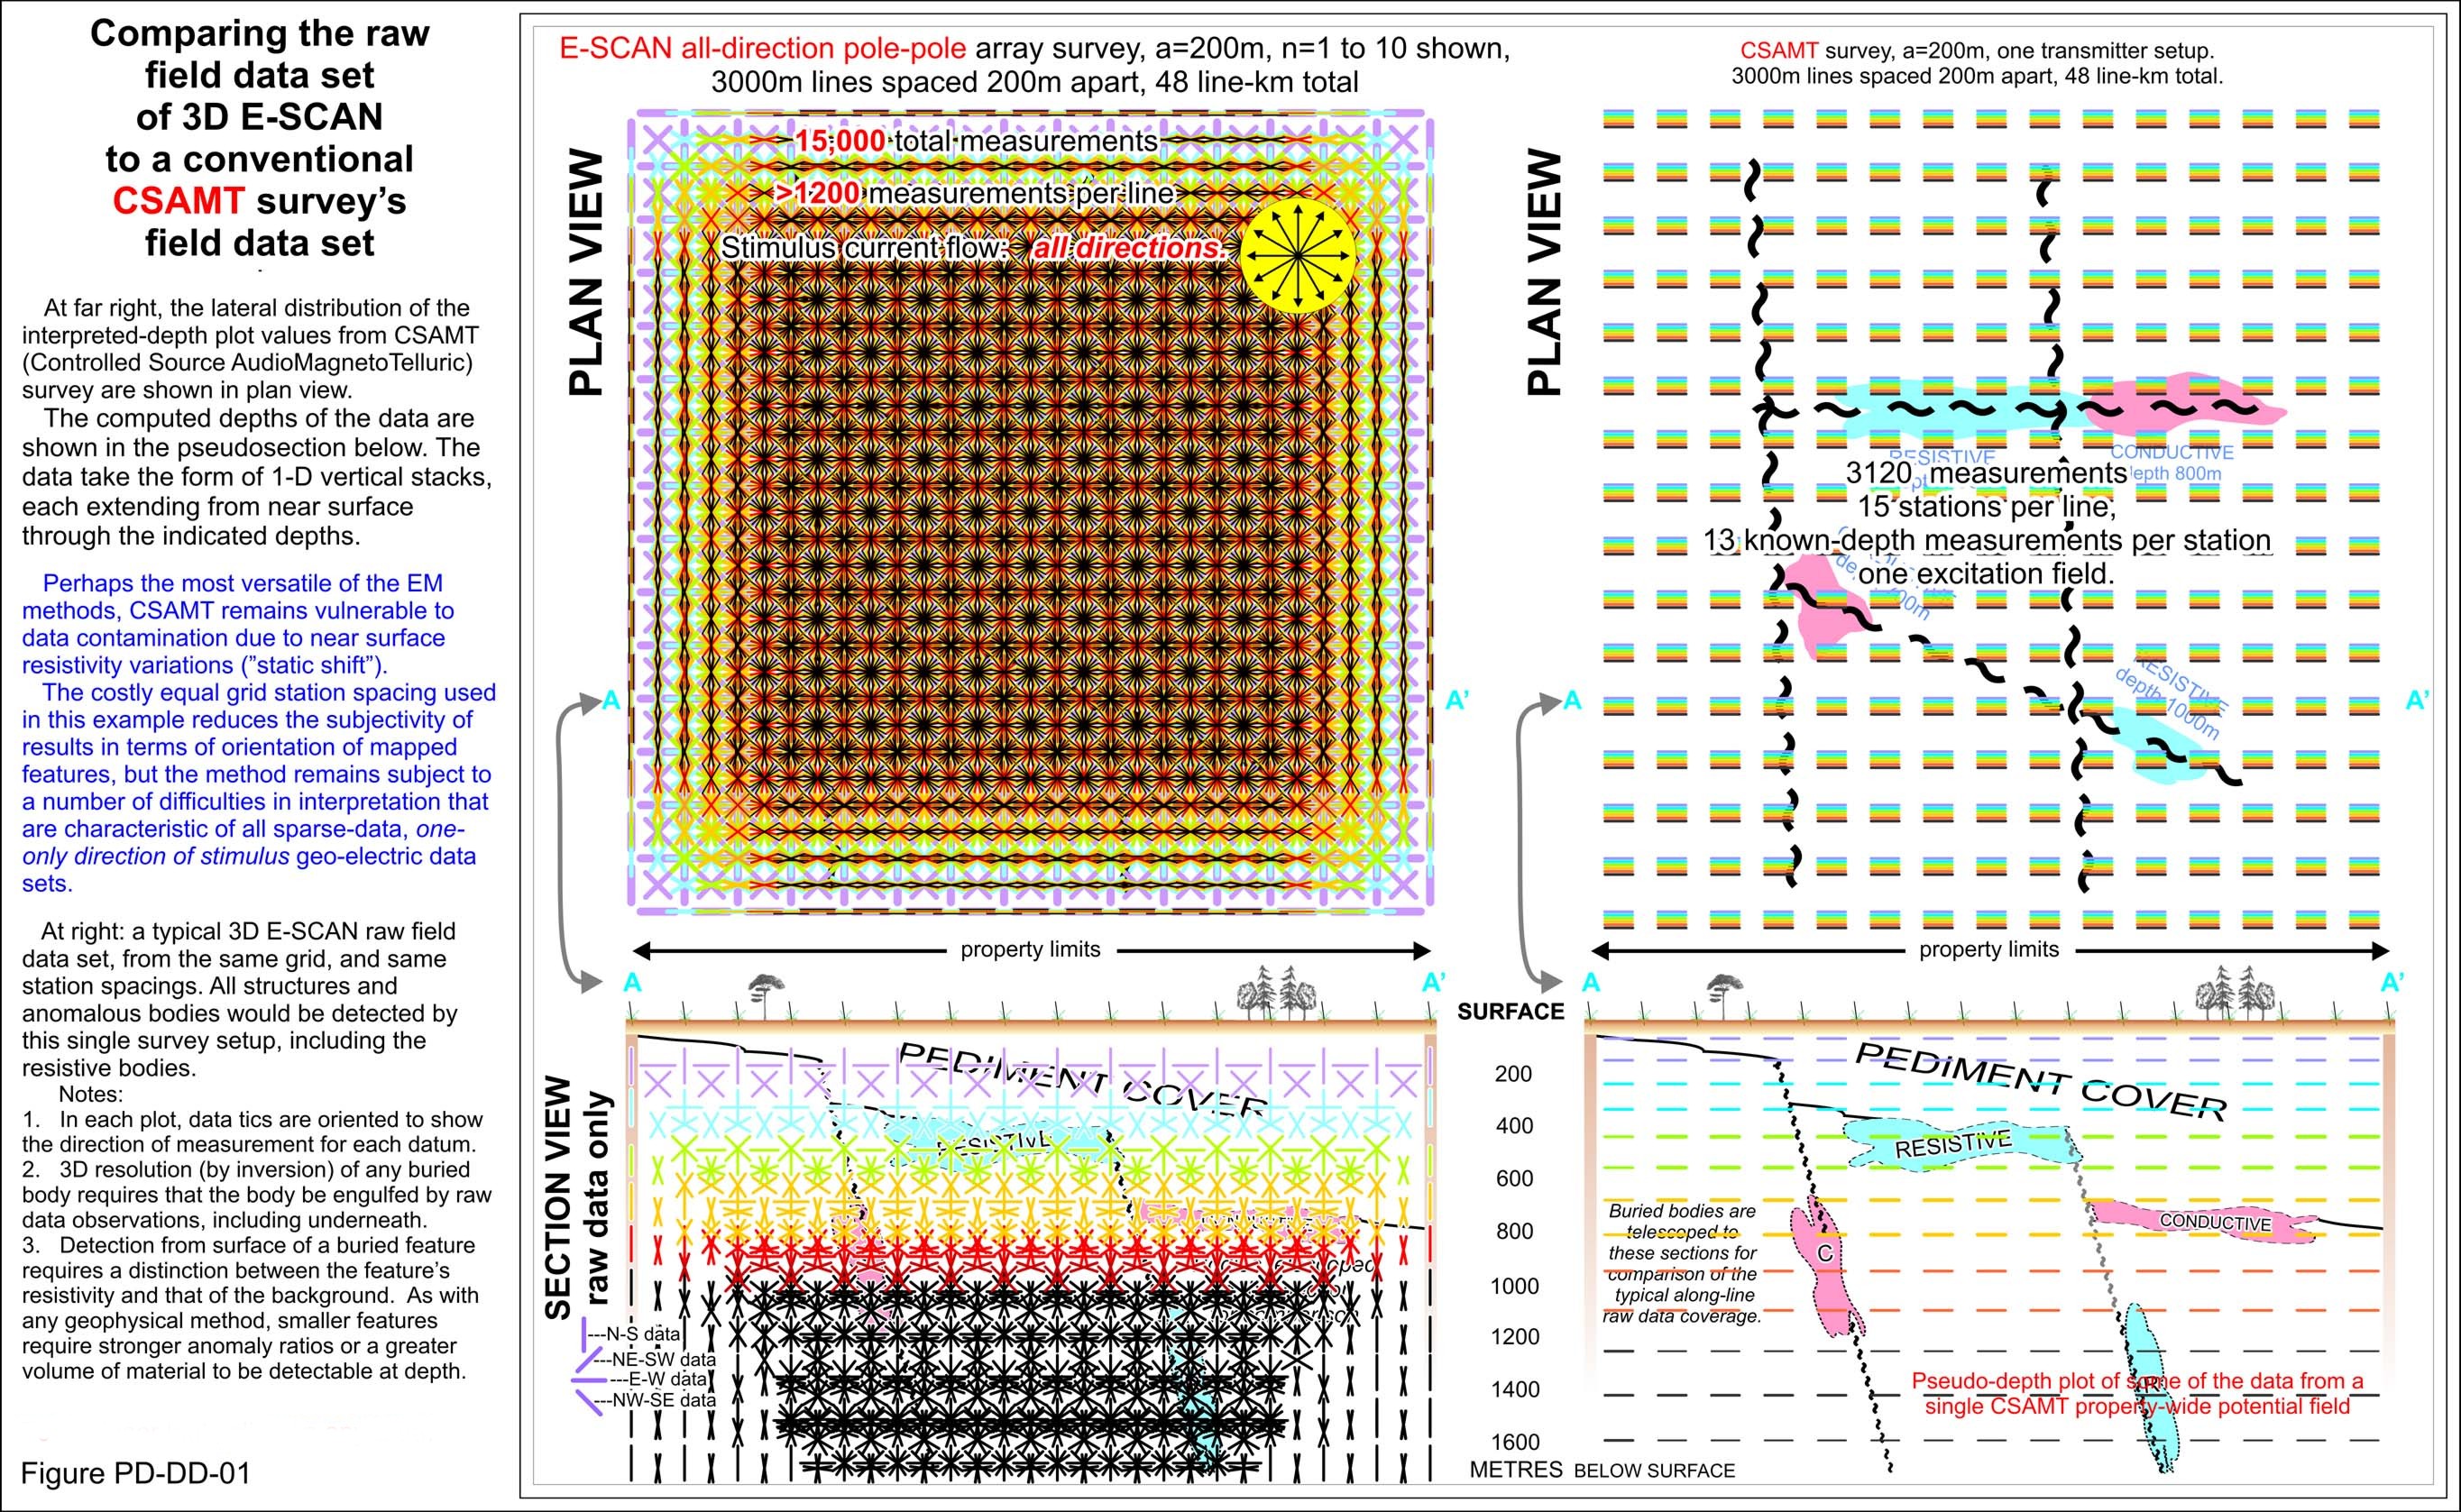
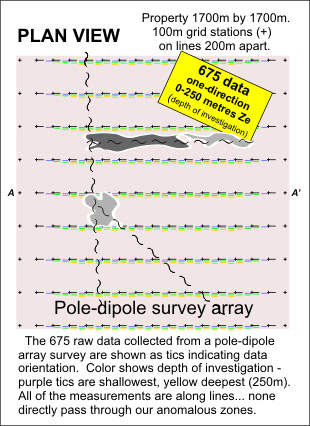
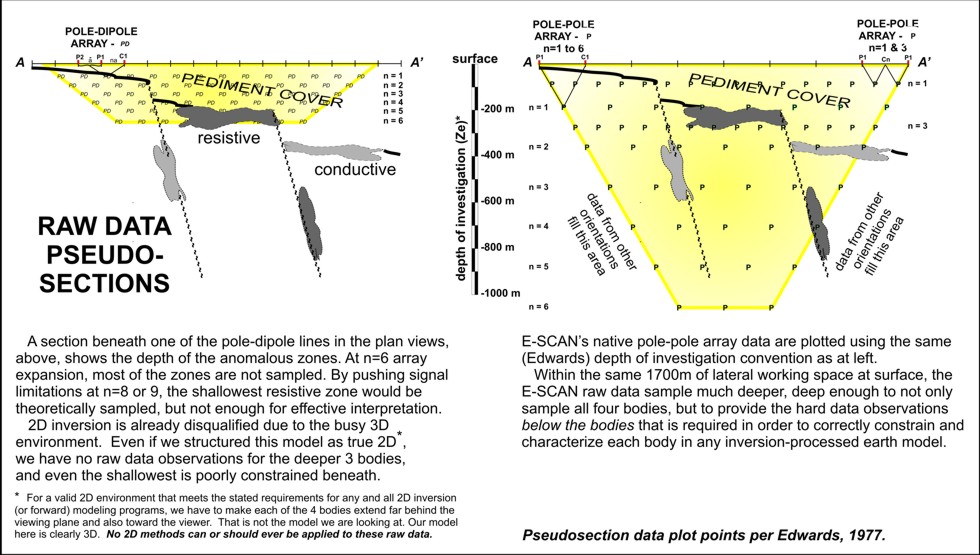
Interestingly, the historically most frequently used array, dipole-dipole, provides the least penetration of the commonly-used resistivity arrays.
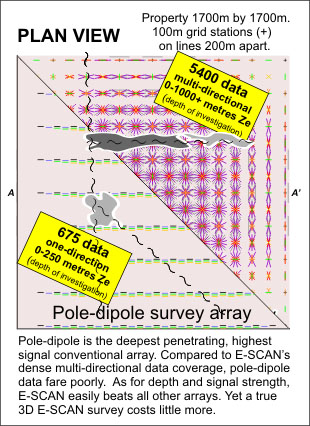
The more expensive and complicated pole-dipole survey array's field data provide the deepest-penetrating (and highest-signal) measurements, and so pole-dipole is often used for deep targets and in difficult conditions such as conductive cover. Pole-dipole array depths are shown below, left.
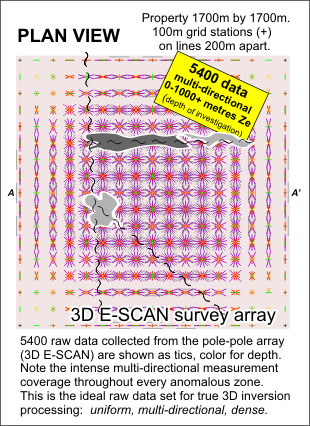
But even pole-dipole depth of penetration is poor when compared to that of E-SCAN's fundamental pole-pole array data, as seen below, right.
Use your understanding of data depth sampling from this website to make sure your planned array is sized and spaced to give you a reasonable opportunity for fully resolving anomalies at your intended depths. Processing is only as good as the field data set you supply.
Interestingly, the historically most frequently used array, dipole-dipole, provides the least penetration of the commonly-used resistivity arrays.
The more expensive and complicated pole-dipole survey array's field data provide the deepest-penetrating (and highest-signal) measurements, and so pole-dipole is often used for deep targets and in difficult conditions such as conductive cover. Pole-dipole array depths are shown below, left.
But even pole-dipole depth of penetration is poor when compared to that of E-SCAN's fundamental pole-pole array data, as seen below, right.
Use your understanding of data depth sampling from this website to make sure your planned array is sized and spaced to give you a reasonable opportunity for fully resolving anomalies at your intended depths. Processing is only as good as the field data set you supply.
Different collinear survey arrays provide different penetration characteristics. A contractor's choice of array may favor operational
simplicity (profitability) at the expense of optimum coverage depth. You might be convinced that with your budget limitations, that's
better than nothing. If you are going to consider a compromise, at least understand what you are compromising,- what you get and what
you don't get as a result of your choices in proceeding with a certain approach. With understanding, you may find yourself either
finding more budget to do it right, or postponing the whole exercise rather than do a half-job and risk more money on a poorly-targeted
drilling follow-up.
Generally, field data need to be acquired from depths not just down to expected target levels, but to twice that depth.
You need plenty of hard-data observations below the target levels in order to properly constrain the geometry of a buried anomaly. Data that just reach an anomalous mass could be sampling a discrete local anomaly (of interest) or they could be sampling the top of a regional scale lithologic unit (not of interest).
If after investigating all aspects, dipole-dipole array survey seems to fit your requirements, lucky you:
you will employ the fastest, lowest cost survey technique while remaining comfortable that you have not cut corners nor spent too much for
your specific application or test line.
CSAMT: Choose the highest power system available to maximize quality and strength of signal, and don't skimp on station spacing - more data from more sites improves the chances of accurate deeper feature resolution, especially when surface variations impact individual station data. Use a square grid station layout to minimize directional bias... avoid widely spaced lines that will fail to unambiguously resolve cross-breaking structure delineation, unless you don't care about cross-breaking possibilities and are interested only in tracking the distant extension of a known linear structure (2D). Cover the area of interest, plus some... so you can properly recognize anomalous patterns in context.
More equally-distributed stations = more cost = more objective results, less ambiguous earth models, fewer drilling misses. (LARGER IMAGE)
Try this: lay out your area of specific exploration target interest, then ask your contractor for a discount on adding 2 or 3 extra stations or lines on all sides, for context, at a steep discount in price. Or ask for an extension, at cash cost, over the adjacent known orebody mineralization, to generate a local signature example. If you can, offer to release survey results later for a case history, in return. There is a sense of fairness in this - you get a better model context, the industry gets a valuable look at strategy and results, and the contractor retains his core area profit while receiving a promotional opportunity for the future. Premier Geophysics has done this often over the years, in developing and proving 3D E-SCAN.
With the extra penetration and signal levels of a pole-dipole survey, you can push the array to greater "n" spacings, approaching n=10 or more, before running out of signal. In some cases, this could be equivalent to 50% greater depth sampling than a dipole-dipole survey, without having to increase dipole size and without losing shallower details. For all but very shallow targets, choose a DC resistivity survey array that provides the extra signal and depth performance that is needed to extend your raw data sampling to depths approaching double that of the desired final exploration imaging. That means choosing pole-dipole over the dipole-dipole array, or pole-pole over anything else.
For a survey approach that optimizes depth of investigation in balance with the other four issues on this page, consider using pole-pole... 3D E-SCAN style.
What usually limits depth penetration is signal strength. As you measure progressively deeper, signal strength falls off until a point is
reached where signal
can not be discriminated from ambient electrical noise. When signal fails, you need to increase transmitted current
levels to boost the signal, or to expand a measurement dipole in order to sample a larger potential difference.
There are operational limits to both approaches.
Of the two commonly-used conventional survey arrays, dipole-dipole has the worst signal performance. For a given effective penetration, a pole-dipole array measurement will have 20 times the signal of the dipole-dipole array, using the same current input. So for deeper measurements, pole-dipole has two advantages over dipole-dipole: greater effective depth (per unit of array length along surface) and greater signal strength.
Pole-pole array data have always outperformed both of the other arrays, but (until E-SCAN) pole-pole has seen little commercial application due to operating inefficiencies. For the same effective penetration and current input, pole-pole signal can be 100 times greater than dipole-dipole, and 20 times greater than pole-dipole. That large advantage brings major practical operating advantages, especially in conductive cover regimes where signal loss (diversion) is an issue.
WHAT YOU CAN DO:
DC resistivity: If you have been using the dipole-dipole array for line surveys, look into pole-dipole. For a given dipole length (same survey grid), you get better penetration with higher signal, more information content in each measurement, and reduced exposure to bad-data impacts from compromised electrode stations. You pay more, it's more complicated to run, uses more wire, and heavier equipment is involved. The results may be worth it, but it requires a case-by-case evaluation. If you can deal with a contractor who offers both arrays, you may get less-biased recommendations for your evaluation.
For ultimate depth capability, pole-pole can be done by any crew capable of pole-dipole surveys, given extra wire supplies and budget. However, by the time a competently-dense (but still unidirectional and sparse data) pole-pole survey has been paid for, you probably could have contracted 3D E-SCAN's pole-pole and resolved the several remaining critical issues that accompany depth considerations: - multi-directional (true 3D) data, greater data density, uniform distribution, noise- and error-tolerance.
3. UNIFORMLY DENSE EARTH SAMPLING
Collecting high density data means you are objectively mapping,
not just chasing some preconceived anomaly type.
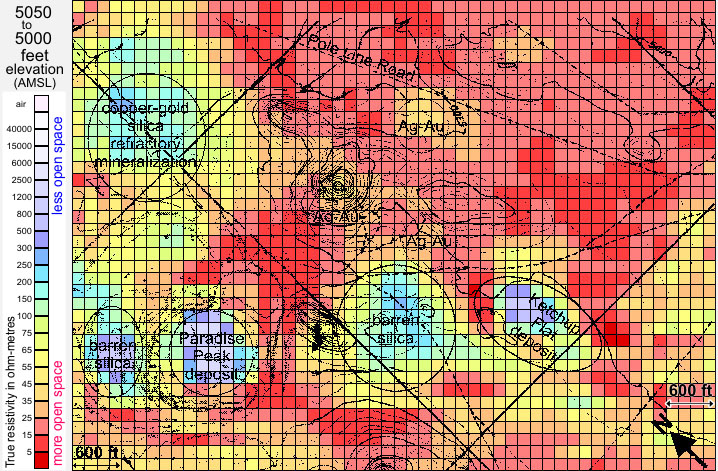
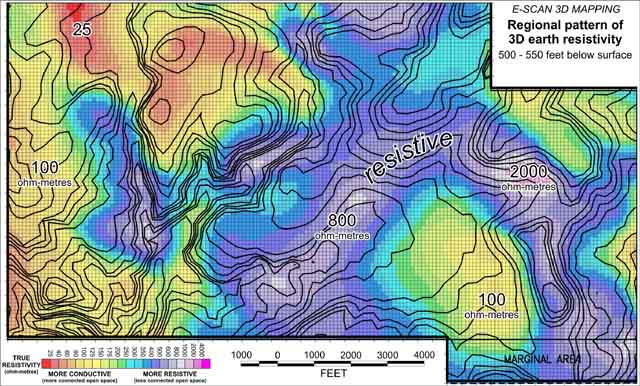
Taking these interpreted elements to the east, we see similar values in the 100 ohm-metre area surrounded by a resistive ring structure, but neither aspect
represents the same geologic equivalents as in the western area rocks. The central yellow area is in fact an intrusive, the granitic Hatter stock,
fractured and cooked up until it looks the same (geophysically) as the weathered volcanics elsewhere in the area.
Surrounding the stock, the resistive rocks may be silicified, but they have the potential to be quite different, occurring in an annular pattern surrounding an intrusive body. Different altering fluid source? Thermal shock? Contact metamorphism? Many possibilities depending on the age relationship between the stock emplacement, subsequent pulses, and the age of the alteration marking the annular ring.
This process of evaluating and understanding is typical of what happens when a detailed, subtly-resolved pseudo-geologic image of an area becomes available for study. You have no doubt done this with aeromagnetic maps, correlating patterns with known ground geology, making possible connections and extensions, proposing geologic models and local processes. As with magnetics, resistivity patterns require follow-up to confirm their geologic nature. In the course of this process, previously unexpected signatures may be investigated, perhaps revealing new types of economically significant features. This is an example of the exploration value that can come from large scale, dense-data resistivity mapping, which of course is a standard result for any 3D E-SCAN survey that is allowed to cover sufficient ground in its mapping sweep.
Recognition of any anomaly requires, by definition, the mapping of a surrounding non-anomalous background context against
which the anomalous feature stands out. Otherwise, no "anomaly".
Recognition of a subtle anomaly multiplies the importance of having a reliable and highly-resolved (even if featureless) background signature.
Obtaining a sufficiently broad overview may be key to understanding the patterns and anomalies that are allowed to stand out in an exploration area. But beware - understanding background versus anomaly is not a simple numbers issue, though that's what conventional surveys must count on for success. Since any rock can exhibit virtually any resistivity characteristic, depending on it's local mechanical condition and state of alteration, anomalies are more universally defined by pattern.
In the image below is a mix of intrusive, sedimentary and volcanic rock types in a northern Carlin Trend gold area. At first view, background values could indeed be suggested at about 100 ohm-metres,- the yellowish moderately-conductive areas. The grey-purple highly resistive areas would be conventionally thought of as a tight sediment like limestone, or a silicified volcanic, or perhaps an intrusive (granitic).
Before we look eastward, let's get the million ounces out of the way, at left. The mineralization host signature is a resistive purple-blue, not unexpected (but also not always the case) for a known silicic system. The surrounding 100 ohm-metre background signature surrounding the mineralized area now looks firmly like background, the signature of moderately weathered and fractured, unmineralized volcanics.
Mouseover the image below to display some ore structures.
WHAT YOU CAN DO: Whatever survey you choose, keep station spacing and line intervals close, to maximize measurement density.
This improves definition of background values for better (more subtle) anomaly recognition and delineation.
Try to extend survey line lengths past the suspected limits of target interest, and then extend a few lines each way along strike. This shows what the host rocks look like, outside of the exploration focus area. Anomalies will have a better chance to terminate, to become discrete bodies, to be discriminated from images that might otherwise only sample the corner of a regionally-prevalent rock type... i.e. no anomaly at all. The chances of recognizing a subtler anomaly are increased as well, as the pattern of the background (non-anomalous) host rocks is better understood.
Remember that a greater density of measurement stations (and measurements) is not just about anomaly resolution... it also improves the ability to detect and remove occasional bad data points with reduced impact on the overall survey results. This is especially important for surveys done in compromised industrial settings.
Increased data sampling density is critical for developing resolution that may illuminate unexpected, different anomaly signatures,
perhaps subtle ones, that could add to the economic potential of the property. Turning an anomaly-chasing survey into a mapping
survey is principally a matter of more data - higher sample density. For a survey approach that optimizes raw data density
in balance with the other four issues on this page, consider 3D E-SCAN.
4. COMPLETE CONDUCTIVE-RESISTIVE SPECTRUM COVERAGE
Are you using the right type of geophysics?
Will your survey even recognize a resistive anomaly?
The ElectroMagnetic methods still struggle with costs and equipment, with CSAMT perhaps showing
the most progress in data saturation, if only clients can be persuaded to pay for appropriately dense station coverage.
DC resistivity methods (conventional collinear array surveys like dipole-dipole and pole-dipole surveys) have progressed very little, with the automated access to multiple in-line electrode stations advancing the cause only marginally, mostly speeding up acquisition of essentially the same type of data set: sparse and uni-directional. The single exception appears to be 3D E-SCAN, where an orders-of-magnitude advance has been made in all of the required areas, - uniformly distributed high density, uniformly distributed all-directionality, all with greatly enhanced signal levels and greatly extended depth of sampling... pretty much describing what has been called for at every significant conference of electrical geophysical researchers over the past half-century.
Of course, without a breakthrough in field application cost-effectiveness, even the 3D E-SCAN technical advance would have remained shelved, too complicated and too expensive. Easy to say "more data", but extremely difficult to deliver.
While you might like to hear how your present survey methods can be improved in this area (resistive target sensitivity) by adjustments to line spacing and station density (by all means tighten these as much as possible), the reality is that for both EM and DC resistivity, whatever you can afford to implement with conventional systems is still not going to be enough. A sea change is needed across the board, the CAT-scan improvement over the flat X-ray, something on the order of 3D E-SCAN's achievements. For the present, you do have the 3D E-SCAN solution available to you, if resistive target resolution (or full-spectrum objectivity in general) represents your exploration or engineering need.
All controlled-source electrical geophysical methods, the ElectroMagnetic (EM) and the DC resistivity methods, do a reasonable
job of detecting strongly conductive anomalies.
Detection of resistive anomalies, on the other hand, is subject to high failure rates by all methods.
If you set out explicitly to map resistive anomaly targets, such as silicic volcanic-hosted epithermal gold deposits, you may be in trouble from the start. But even if your suspected target is conductive, failure to map equally in the resistive end of the spectrum leaves an incomplete picture of the sub-surface geo-electric patterns. Economic mineralization may be missed, and importantly, there will be no opportunity to view and assess the complete imprint of hydrothermal processes on the survey area.
Resistive bodies react more subtly than conductive bodies, whatever the nature of the controlled-source stimulation. Compared to conductive bodies of similar size and anomalous ratio, resistive bodies require a far greater density of more subtle measurements to ensure recognition and imaging not just in the face of ambient noise levels, but also in terms of forcing prominence within an inversion algorithm's treatment of perhaps more strongly-indicated geologic features. Mapping in the resistive end of the conductive-resistive continuum is thus directly tied to field sample density, which is in turn tied to a multi-directional measurement capability (as a means of increasing the density of sampling of a given earth volume without actually repeating any measurements).
To date, progress in achieving the goal of equal full-spectrum mapping sensitivity has been minimal. Relatively sparse data sets still prevail, and advances seem in most cases to concentrate on more processing of the same sparse data, rather than biting the bullet and simply getting more hard field observations (data).
5. OBJECTIVE "BAD-DATA" IDENTIFICATION AND ELIMINATION
Do your survey data guard against misleading results due to bad measurements?
Can you challenge, test and prove the validity of any subsequent 3D model or model detail?
These multiple measurements should agree, in general. If one measurement is substantially different, its origin can be traced to just two
electrode sites. If one of those sites is compromised (the cause of the bad datum), then other data shot from that single electrode position
should also fail to agree in similar tests of other volumetric sub-areas, logically confirming a bad electrode (or a nearby source of
distortion such as a grounded fence or buried pipe). All data associated with that single electrode station can be eliminated forthwith.
This logical identification of an electrode site that is involved even in subtly-bad data generation can only be done with the dense,
multi-directional and simple (2-electrodes only, per datum) data set that E-SCAN always acquires. This is an example of only one of several
statistical/logical/reasonableness tests that are applied to the entire 3D field data set prior to inversion processing. Even when a bad
datum or bad electrode (=50 to 70 bad data) is missed, its effect on the inversion result is diluted by the presence of a large number
of other undamaged values obtained for the same volume area(s). The same large number of data that were used to identify the errant
data or electrode are of course more than filling the data gap left when errant data are removed. Effectively no gaps left in the data set.
Survey methods that generate only sparse data sets provide none of the diagnosis, repair and confirmation tools and materials needed to objectively evaluate and clean a field data set, never mind provide an audit trail for later review. 3D E-SCAN does, and always has. That may be your best option when project-critical decisions rest on geophysical results, and especially when you knowingly undertake a survey in or near very (electrically) noisy industrial site conditions. That this suite of quality control mechanisms is in place even for 3D E-SCAN surveys in quiet environments is just another guarantee of a solid, verifiable outcome,- even if the sun starts to act up unexpectedly mid-survey, swamping the area with telluric noise.
Data quality, field costs, and the field schedule are all protected in every circumstance... one of several powerful reasons why Premier Geophysics is prepared to quote and guarantee in advance a fixed cost for the completion of a survey in virtually any future conditions.
A single survey electrode inadvertently located near a buried pipe or grounded fence can spoil, irretrievably, an entire line of survey data.
Conventional surveys tend to acquire sparse raw data sets in which very little is overlapped or independently repeat-sampled. This leaves little or no opportunity for evaluating and certifying data quality, beyond simple "reasonableness" observations. When blatantly "bad" datum are identified, there is a lack of backup data to replace those found to be defective. Non-blatant but critically "bad" data may slip through the only evaluation tools available to alter an inversion outcome toward a false earth model.
Of course, survey operators should be reviewing field data nightly, but even then it takes a large degree of distortion to make a bad datum recognizable in a raw data plot. The less-than-obvious problem data will survive this review to influence the data processing later.
What can you do? If problem data are caught while the system is still in the field, re-shooting an adjusted lines can be done to recover missing data. Once a crew moves on, it is very difficult to get back and re-establish the survey to fill in the hole in the data.
In processing, either the raw data affected by the source of distortion are removed, leaving a sizeable gap in effective survey coverage, or the data are left in place in the faint hope that inversion processing will manage the errors and still produce a "worthwhile" image... clearly a bad idea.
WHAT YOU MIGHT DO: Ask the developers of your automated inversion program(s) what they think about using the program for a quick daily test of survey line data for the purpose of identifying gross misfits with initial inversion models. Do they think that such data misfit annotations could be used as a field alert to possible or probable defective data? With e-mail, such tests could be run on daily data by someone at the office, supporting several crews at once. By reporting back quickly, field crews could re-shoot troublesome data at minimal cost.
WHAT YOU CAN DO: The 3D E-SCAN system gathers a very high density data set whose multi-directional characteristic means that any given volume of sampled earth is measured by similar arrays oriented at a full range of directions across that same volume.
COMMENTS
If any of the the first four critical elements (bad data correction is often not a critical issue) is substantially
missing from your survey data, the 3D earth model that will be produced will still look like any other 3D earth model result, and can
be sliced, diced and displayed in rotating iso-surface renderings just as any 3D image should. However, it will be inescapably limited
in objectivity and accuracy by the one or more major deficiencies in the raw data set that was used to generate the model.
In the material you have just reviewed, you have a list and explanation of what those deficiencies typically could be, and how they will impact the information that your 3D survey results will deliver. Discuss these aspects with your geophysical survey provider before undertaking a survey so that you can perhaps adjust the survey strategy to minimize the limitations in the area(s) that you consider most important to your exploration progress.
If the survey data already exist, similar discussion can help you to understand what could be missing or poorly represented. In some cases (e.g. volcanic-hosted epithermal gold orebodies) a "3D" earth model based on sparse, uni-directional line data is likely to miss such a target... could it be important for you to know that the lack of target images in your "3D" model may reflect critical element deficiencies in your data set, and not a confirmed absence of orebodies?
The technical discussions, examples and case materials of this website provide for just one science-based conclusion: "If you want true 3D resistivity, meaning that all critical elements are satisfied, you have to use 3D E-SCAN." Please take the information that is presented here and use it actively, ask questions of your geophysicist or consultant, get the general (and the site-specific - your project) explanations, perspective, and critiques that he can and will offer. Apply you knowledge to improve your conventional survey efforts, and if that seems insufficient, take a look at how 3D E-SCAN would handle your specific project.
Regarding "3D" results, "3D" earth models: This discussion has shown you what is needed, and why,
in order to obtain an objective true 3D earth model, a model that does not leave out various categories of anomaly orientations, anomaly
depths, or anomaly types (e.g. resistive or conductive), and that has minimal subjective involvement in its creation.
These discussions will help you to do a better-informed job of specifying and planning your next conventional resistivity survey program. Hopefully, you will better understand some of the implications behind your contractor or consultant's suggestions that some extra area be covered, or that line spacing be tightened,- always at extra cash cost to you. All line-based surveys can benefit from paying attention to these five critical elements, even though a couple of aspects will remain unavailable to conventional surveys (e.g. uniformly all-directional data).
Your two biggest improvements are potentially achieved when:
1. you review line and station spacing, and decide to tighten up one or both of these to obtain more (and more-uniformly distributed) field data.
2. you consider your economic target zone and elect to expand survey coverage to provide a wider view of the background signatures, i.e. the geo-electric context.
Both of these require more survey, more cash costs, but there is clear value in this investment, in terms of better recognition of anomalies and target characteristics that will pay off in the next (and much more expensive) stage: drilling. The better understanding of the setting will not only support more intelligent drilling strategies, but it can actually reduce the number of drill holes required for a competent examination. This is the proven case for true 3D results... it can also be achieved to a significant degree with some improvements to conventional surveys, as suggested here.