3D E-SCAN acquires the high density, uniformly distributed, fully multi-directional field data required by 3D inversion programs in order to deliver objective, full-spectrum 3D earth resistivity mapping. No other survey technology comes close, even in ideal survey conditions. 3D E-SCAN performs in any terrain and in all industrial environments, without compromise.
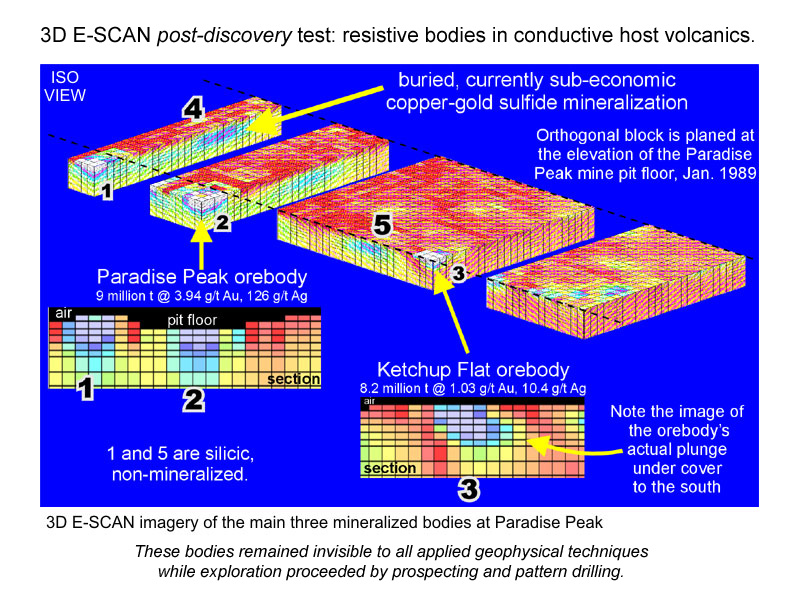
"Full-spectrum" E-SCAN routinely maps the resistive signatures of volcanic-hosted epithermal gold deposits,-
a target proven to be difficult for all other techniques.
Who should be interested?
- All users of 2D and 3D IP and resistivity surveys, CSAMT and various EM ground surveys, anywhere.
- Explorers experiencing difficulties in mapping epithermal gold targets and other resistive systems.
- Explorers in difficult terrain or complex conditions.
- Anyone involved in mapping diamonds, uranium, hydrocarbons, base metals, precious metals, groundwater, civil engineering, archaeology and other geo-electric explorations.
Most of Nevada's prospective volcanic-hosted epithermal gold areas remain effectively untested or insufficiently-tested today.
3D E-SCAN's unique ability to map these resistive targets is matched by affordable costs, even in difficult terrain.
If you thought Nevada was getting short on untested prospects, think again. The first pass was done effectively blind.
3D E-SCAN's unique ability to map these resistive targets is matched by affordable costs, even in difficult terrain.
If you thought Nevada was getting short on untested prospects, think again. The first pass was done effectively blind.
The key to successful imaging of resistive epithermal gold orebodies lies in the acquisition of a dense, multi-directional true 3D raw data set.
As powerful as 3D inversion algorithms may be, they can do nothing without true 3D raw data sets to guide their every detail and force an objective 3D earth model. Imagine offering a hundred flat X-rays to the CAT-scan software for "3D image processing"... Same thing here: the right type of data is needed, and plenty of it.
When it is delivered, the detail with which previously undetectable orebody signatures are revealed is nothing short of stunning.
Many case history examples of "undetectable" orebodies are offered on this website, along with 3D E-SCAN's unambiguous, objective orebody models.
This slide show introduces the true 3D raw data set, so that you can understand how different it is from the conventional field data that you have relied upon, these past many decades.
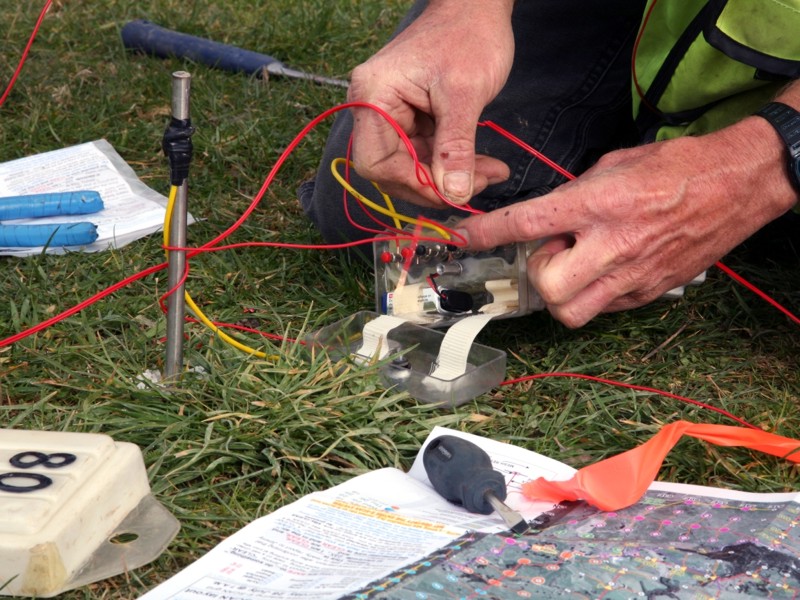
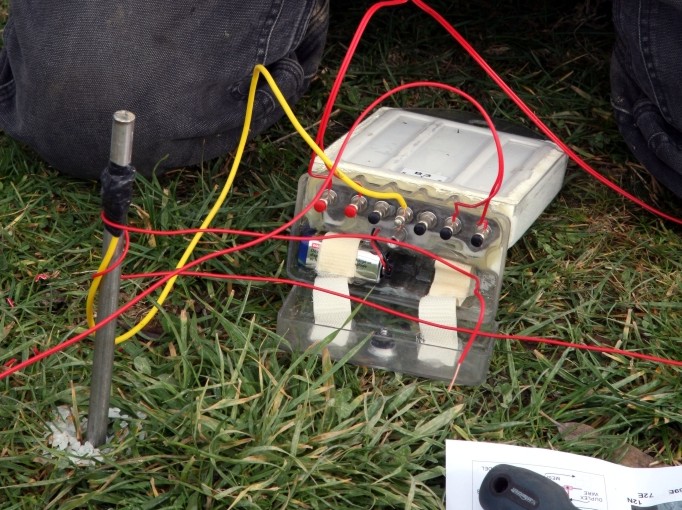
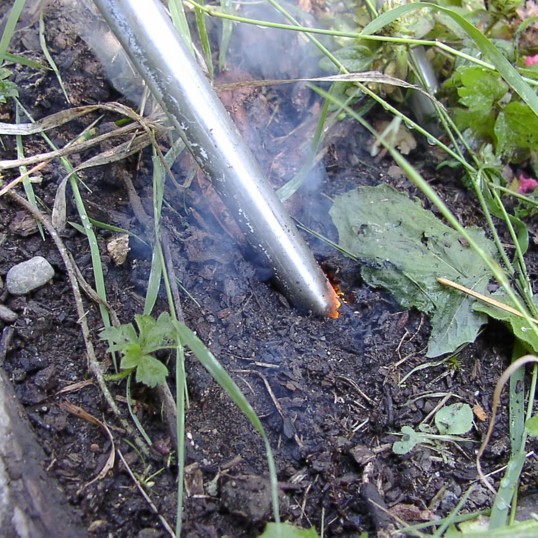
This box controls three survey electrodes. Its independent microprocessor communicates
with the central controller, confirming actions and supporting evaluation of individual
electrode contact conditions to ensure competent data.
with the central controller, confirming actions and supporting evaluation of individual
electrode contact conditions to ensure competent data.
E-SCAN's electronic switching devices instantly adapt to extreme topography and complex setup situations, leaving line-dependent surveys far behind. By avoiding use of multi-conductor cables for electrode access, numbers are expanded beyond the usual 8 to 24 electrodes to more than 300 electrodes at a time, located not just along a line but everywhere across the survey area.
Perhaps most important - 3D E-SCAN technology breaks the cost-effectiveness barrier that for 50 years prevented the use of the highest-performance field survey array -
the pole-pole or 2-electrode array.

3D E-SCAN setup is independent of any pre-survey orientation guesses.
It will uniformly measure in every orientation, eliminating any chance
of a bad or unlucky directional commitment at the outset.
It will uniformly measure in every orientation, eliminating any chance
of a bad or unlucky directional commitment at the outset.
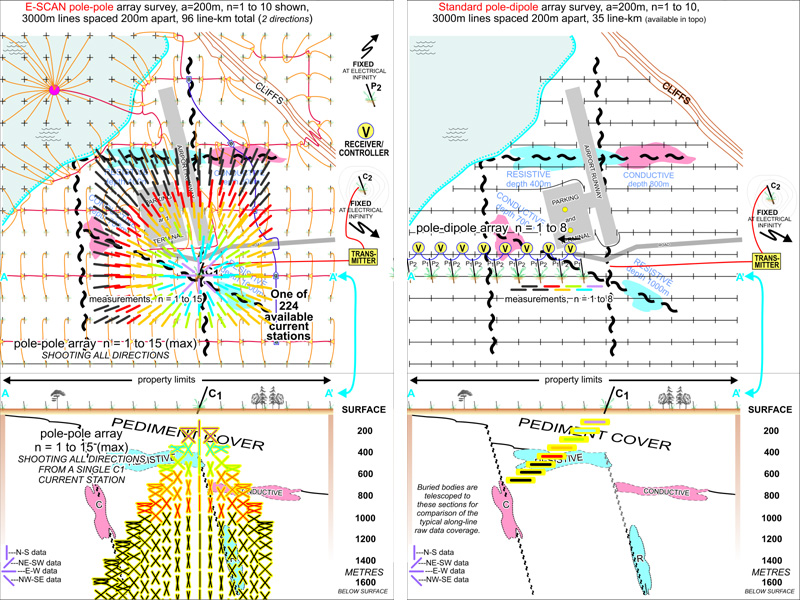
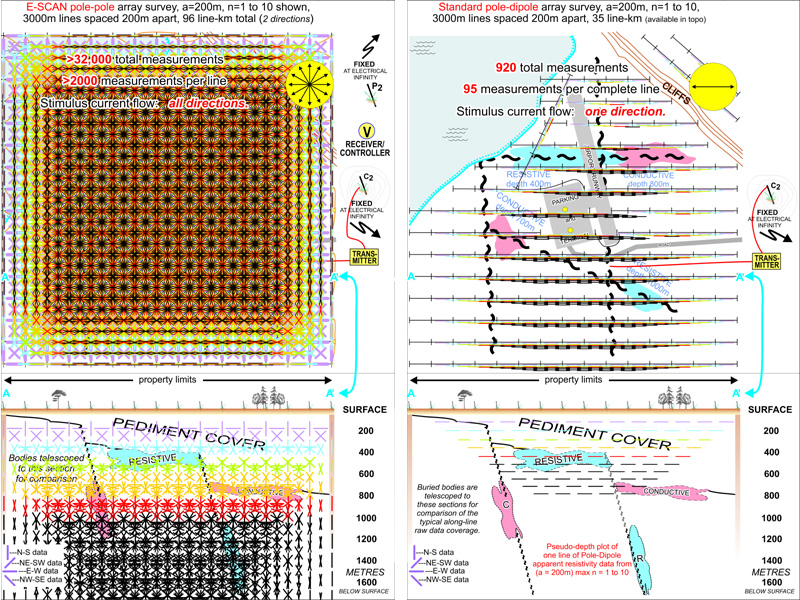
Four anomalous bodies are buried at different depths, in association with a system of major north-south structures and two crossbreaking structures.
Conventional survey planning requires pre-survey guessing of what orientations may be most significant, so that survey lines can be oriented accordingly (perpendicular to expected structures or to the long axis of target bodies).
In the absence of prior estimates of probable target orientations, any survey orientation is chosen, usually to take best advantage of site operating conditions by avoiding obstacles, or by using an existing road as a base line.
What orientation would you select for this model:
- main north-south fault structure illumination (uses east-west lines) or
- crossbreaking structure illumination (uses north-south lines).
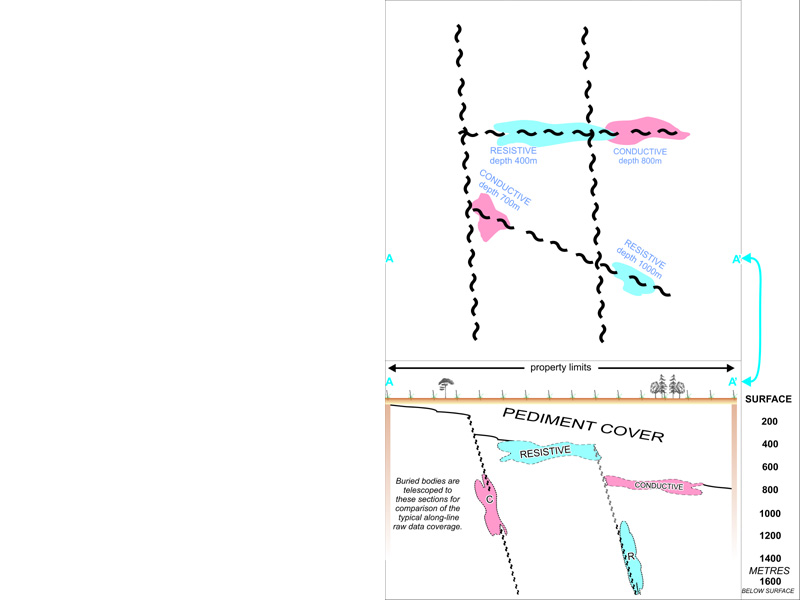
These test results and the test itself are scaleable. Instead of the 200 metre station spacings used here,
you can substitute 15 metres or 400 metres, and adjust the vertical scale accordingly.
you can substitute 15 metres or 400 metres, and adjust the vertical scale accordingly.
All test results will deliver raw data "pseudosections" that will cross each of these four bodies. The buried bodies have been telescoped onto this single section, so that we can see how the various data sets plot in relation to the test targets.

A lake, cliffs and an airport facility with asphalt-paved runways and parking areas are added.
This is a reminder that survey data sets are susceptible to gaps in data caused by site obstacles.
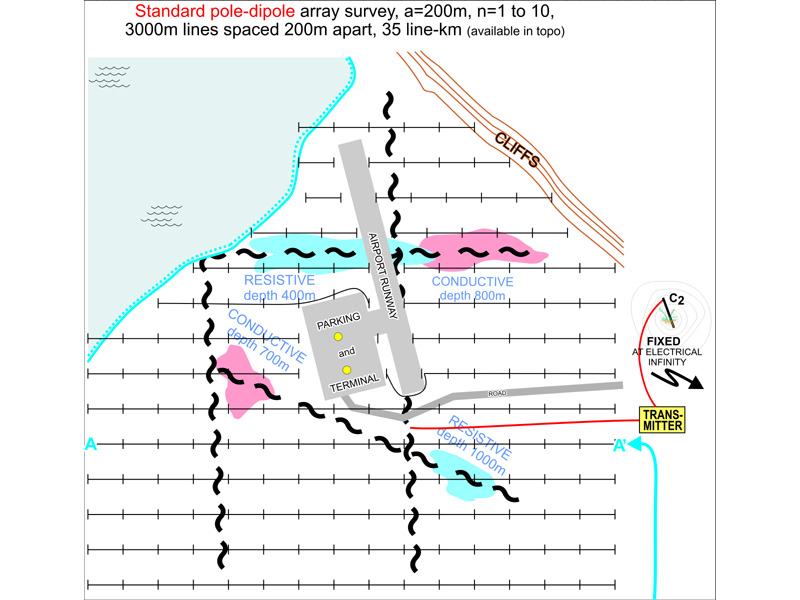
The lake and cliff area are avoided here. While lines could be installed up and over the
cliffs with some difficulty, the lake area would likely remain excluded from survey testing.
cliffs with some difficulty, the lake area would likely remain excluded from survey testing.
E-SCAN field data will be compared to those generated by a pole-dipole array survey, as laid out on the grid lines shown here. The pole-dipole array was chosen because it delivers the highest performance of the conventional exploration survey arrays, for example providing deeper penetration and greater signal return than the dipole-dipole or any other commonly-used array.
The two most-used survey arrays and E-SCAN's pole-pole array are closely related.

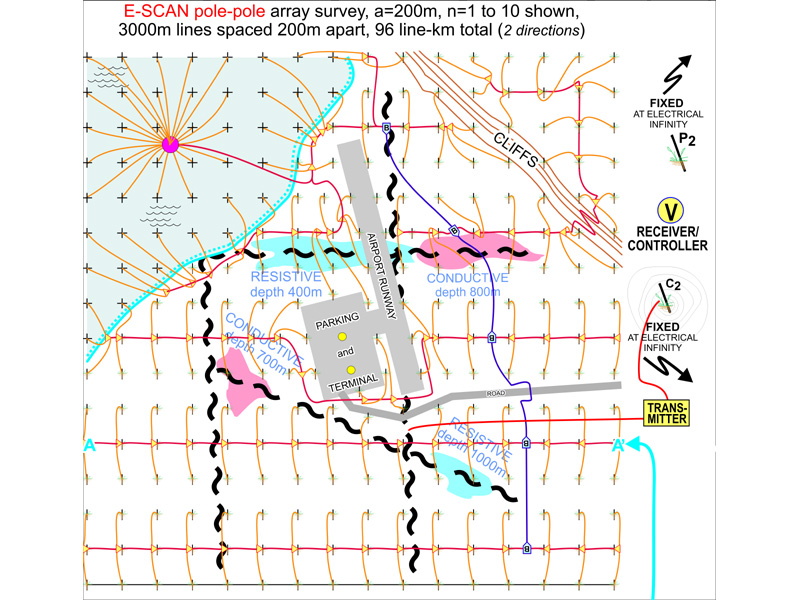
E-SCAN is the ultimate in operational flexibility. The lake area is wired (and later "shot") with with a total of a single day's added time and cost. The cliff area is fully wired and shot with no delay or extra cost at all. In the airport area, only two stations are missed,- the yellow dots in the parking lot.
All of the 3D E-SCAN electrodes that will be used during the survey are installed at the outset, rather than a few at a time as with conventional surveys. This usually takes about 3 days. Once shooting starts, the electrodes needed for any measurement are selected, connected (and tested) in a fraction of a second, through the network of microprocessor-controlled switching devices ("boxes") introduced earlier.

In every DC resistivity (and IP) survey, current injected into the ground flows in all directions, establishing an electric potential field that can be detected at surface. Distortions in the observed potential field are clues to the subsurface variations which affect the density and direction of current flow.
One current injection site (C1), and its resulting potential field, are shown here. When the current injection site is moved along the line, a different potential field is generated, and again sampled.
E-SCAN's survey setup at left will utilize 224 different current injection sites, including some in the lake bottom. The pole-dipole survey at right will employ 154 sites. This means the surveys will sample, respectively, 224 and 154 different electric potential fields in the course of completing their field data acquisition.
These field data will be used to interpret the resistivity conditions that must exist in the subsurface in order to have caused the observed potential field patterns at surface.

The electrode and instrument setup for eight pole-dipole array measurements is shown here. At the electrode "C1", current is injected into the earth to establish the electric potential field that will be measured. In traditional surveys, the measurement receiver (V) is connected to a pair of electrodes (the measurement dipole P1-P2), and the voltage difference is measured and recorded. The measurement setup is then advanced to the next dipole for another measurement, and so on until 7 or 10 dipole separations have been measured from the single C1 current input. The C1 input site is then advanced one station down the line, and the 7 to 10 measurements are repeated to sample the new potential field.
For each measurement, we show a colored line or tic, here in plan view, oriented to show the current flow direction for the measurement, and positioned at a point half way between the current electrode C1 and the nearest electrode (P1) of the measurement dipole P1-P2 used for the measurement. In this setup, only 8 of the planned 10 measurements is obtained because the survey encounters the end of the line at n=8.
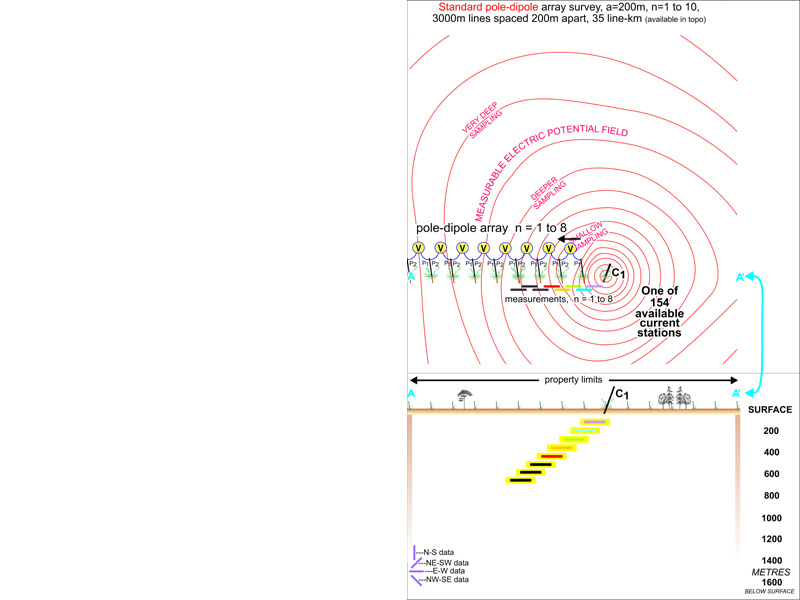
The eight measurements plotted in plan view in the previous image are shown here in a section through the earth, plotted at their effective mean depth of sampling (that nominal depth value computed for comparison purposes using a uniform earth situation). The orientation of the measurements is east-west, as indicated by the orientation of the "tic".
Above - current going into the ground at C1.
For information on plotted "depth", see references: Edwards, 1977, and graphic explanations elsewhere on this site.
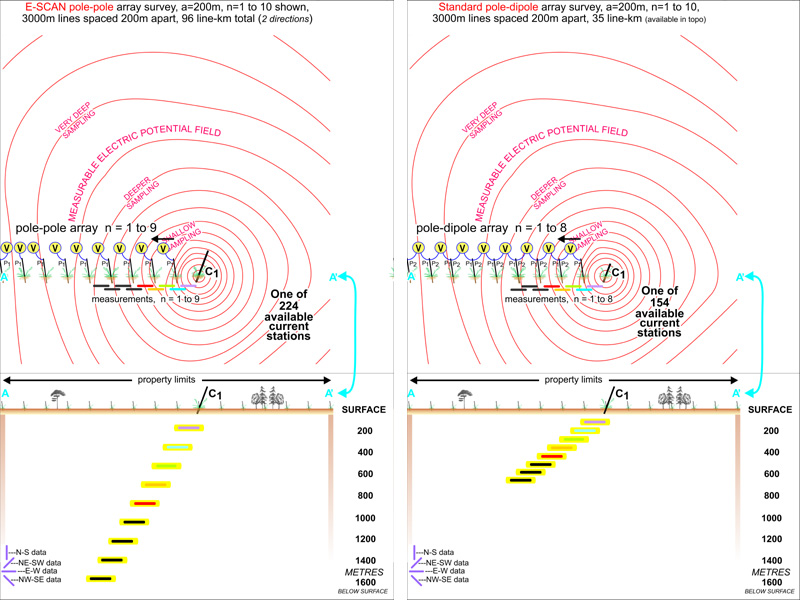
There is enough room for nine pole-pole array measurements in the images at left. They too are oriented along the line, and in plan view plot in similar positions. In the section, the superior depth penetration of the pole-pole array data is evident, but the data set remains sparse and uni-directional, still very limited in usefulness. Remember, the same group of electrode locations is used for each set of data, the only difference being the employment of a second remote reference circuit to allow the pole-pole array to sample the potential field voltage with just one on-grid electrode P1.
This shows why we bother to set up all of the electrodes in one go, rather than spreading the same amount of work out over the duration of the survey.
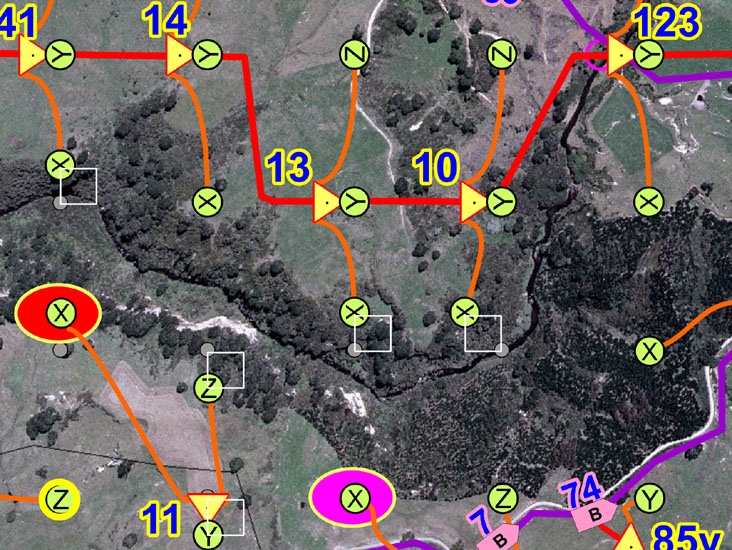
The same potential field, from the same current injection site C1, is now sampled in 224* different locations by the full E-SCAN field setup. This requires about the same amount of time as would be required to make the 8 conventional pole-dipole measurements, i.e. about half an hour.
The close-in tics sample the shallower potential field information, while the outer black tics represent extremely deep sampling from electrode stations at the extreme edges of the survey grid setup. Note the uniform distribution and all-directional nature of the measurements originating from this C1 location. For each of the other 223 current injection setups, the resulting potential field will be sampled in a similarly comprehensive manner, each time generating another 224* raw data for later 3D analysis.
This potential field isn't just sampled, it's defined.
* In actual field operations, about half of these 224 measurements would be made, skipping many of the distant shots as being overly-redundant.
With 224 C1 injection shots completed in about the same time that it would take for the 154 pole-dipole shots, the difference in accumulated field data tells the story of E-SCAN's true 3D resolving power.
Every aspect of the survey area, the lake and cliffs, under the airport, every possible orientation, depth and type of geo-electric feature, all are comprehensively sampled by the E-SCAN data set, providing definitive, CAT-scan-like hard-data constraint for every detail of the objective 3D earth model that is subsequently produced by inversion processing.
Unlike the pole-dipole survey data at right, the E-SCAN data set required no pre-survey guesswork, no parameterization that would emphasize some earth resistivity aspects, while missing or ignoring others.
As the client explorationist, you can say to the E-SCAN geophysicist: "Don't ask me... it's YOUR job to tell ME what is down there." (Even if you choose to reveal some ideas, it makes little difference as to how the survey is conducted, as long as we are getting sufficiently deep raw data to make sure that we effectively test your concepts, along the way.)
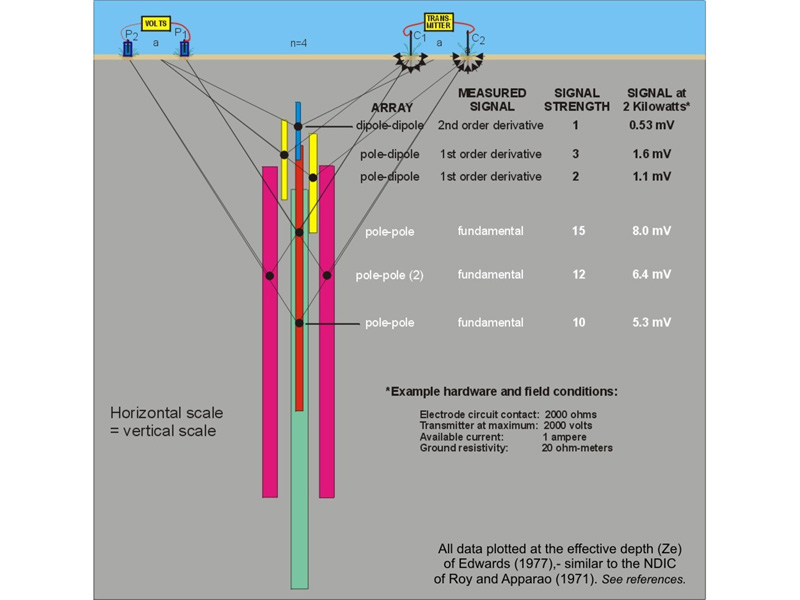
From any 4 electrodes along a line, these array data can be obtained. The superior depth and high-signal characteristics of the 4 pole-
pole data are obvious. The pole-pole data also contain all of the information of the other array data - before it was wasted by adjacent-
electrode subtractions. With E-SCAN's operational cost-effectiveness breakthrough, there is no downside, only strength upon strength.
pole data are obvious. The pole-pole data also contain all of the information of the other array data - before it was wasted by adjacent-
electrode subtractions. With E-SCAN's operational cost-effectiveness breakthrough, there is no downside, only strength upon strength.
Pole-dipole and dipole-dipole array surveys account for almost all of the exploration IP and resistivity surveys done in the past half-century. The pole-pole array has seen little use because its field setup is traditionally so complicated and time consuming that nobody can afford to do it, despite the dual advantages of deeper penetration and higher signal. At left, the deepest pole-pole measurement is four times deeper than the dipole-dipole datum, with its signal level ten times as strong... Using the same distance along the line... But conventional pole-pole simply couldn't compete in large-area applications.
E-SCAN technology eliminates pole-pole's operational disadvantages, matches conventional survey time and costs, and delivers an any-terrain true 3D field data set... the high density, uniformly distributed, all-directional, super-deep data that meet every requirement for the objective generation of a true 3D earth model.
At left, four electrode sites are used for one dipole-dipole measurement. From those four sites, two deeper, higher-signal, pole-dipole measurements can be made. And again from the same sites, four even-deeper, higher-signal pole-pole measurements can be made.
The derivatives are more correctly "remainders", what's left over after subtracting two pole-pole data to make one pole-dipole datum, or after subtracting the two pole-dipole data from each other to get one dipole-dipole datum. You can see in the diagram the loss of depth information (and signal strength) as each subtraction takes place... all of it useful deep-earth information that is being lost in the interest of obtaining a faster or cheaper survey result.
Better target resolution and positioning (and exhaustive condemnation of non-anomalous acreage) equals fewer drill holes to deliver higher confidence results, at less cost, in a shorter time.
... that's something to think about when you budget
your next geophysics+drilling exercise.