LINEAR E-SCAN
This page is being created or updated during October-November 2018
Contact Greg Shore directly for information on LINEAR E-SCAN
gshore888@gmail.com
Greg's cell, 24/7: 1 289 221 3604
Some images from the upcoming LINEAR E-SCAN document:
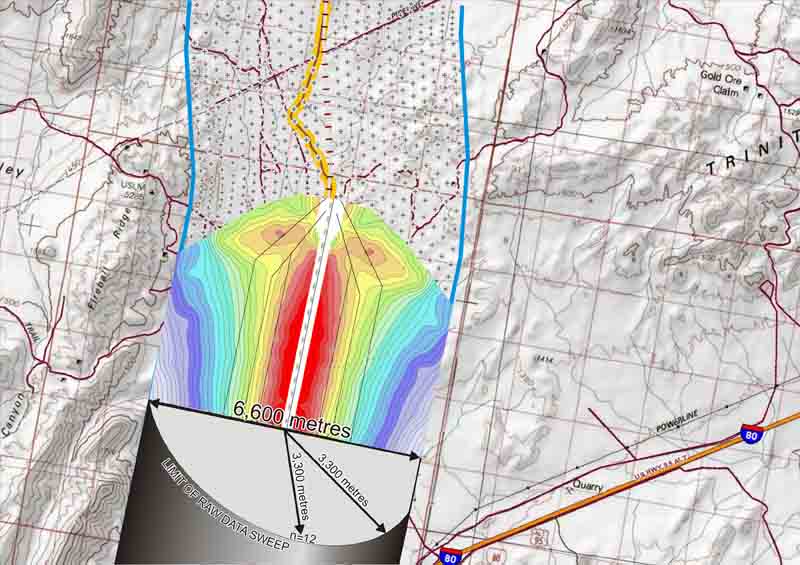
A desert LINEAR E-SCAN sweep seeks large-scale conductive anomalies.

The single-line LINEAR E-SCAN sweeps through desert valleys seeking large
scale conductive targets within its 6.6 Km wide and 3.3 Km deep effective search envelope.
At left, the butterfliy-plot pole-pole array 3D "pseudo-radial) field data presentation shows a strongly conductive near-line anomaly, with a smaller mid-depth or mid-distance anomaly at the north end.
While this example images the thermal fluid outflow patterns of a geothermal system, the LINEAR E-SCAN approach is effective in detecting any large conductive anomaly. Geothermal, unconformity uranium, and IOCG are typical target candidates for LINEAR E-SCAN reconnaissance surveys.
LINEAR E-SCAN is also ideal for cost-effective ground follow-up of large/deep airborne ZTEM survey anomalies. Initially deployed on the ground along the flight line, the LINEAR traverse quickly and positively locates the source of the ZTEM anomaly below or to one side of the flight line (or both), and then roughs it in (True 3D containment) to verify the initial diagnostic drill target.
The client has the real-time option to order the two to five LINEAR 3D constraining line setup to be quickly and efficiently expanded into a full-density, high resolution 3D imaging survey, centered on the defined anomaly, before the field crew departs the area.
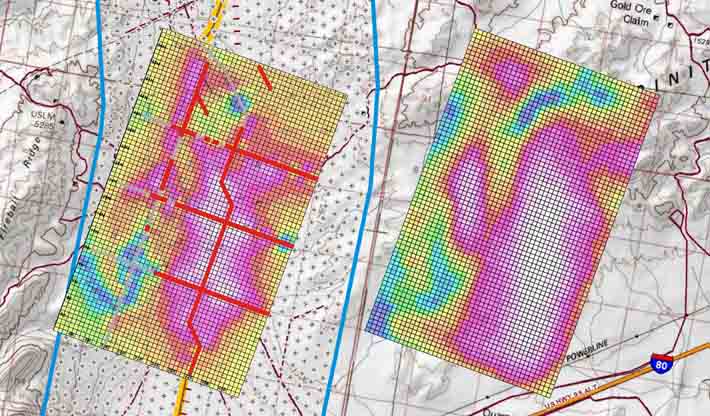
Four simple cross-lines quickly confirm anomaly dimensions and position.

Having detected a conductive anomaly along its traverse path (see the image above), cross-lines are installed to logically constrain the location of the anomalous source material. After adding three cross-lines and one cross-cross-line, a 3D inversion yields a pattern of conductivity (at left) that is very close to that of the full 3D E-SCAN survey result (at right).
With a substantial anomaly system confirmed in place, the LINEAR traverse can resume progress down the valley, in search of more conductive anomalies. Prior to continuing down the valley, the client may elect to expand the cross-line layout to provide comprehensively 3D-data-constrained full-spectrum true 3D mapping, as seen at right. This more-intensive 3D treatment provides subtle imaging of the entire conductive-resistive spectrum (as opposed to just the large conductive features), and can resolve detailed structural lineaments that are not seen in the simpler cross-line results.
(3D E-SCAN case data: Pumpernickel Valley, Nevada.
U.S. Department of Energy and Nevada Geothermal Power Company, 2005).