 The Paradise Peak orebody discovery was the result of a prospecting program that used old mercury operations as focal points. Evidence of the mineralization outcropped,- no geophysics was needed or used.
 Following discovery, FMC Gold Company tried various state-of-art geophysical techniques, both ground and airborne, in attempts to obtain a geophysical signature for the orebody. The hope was to establish a viable geophysical method for exploring adjacent covered ground, in search of additional silver-gold mineralization.
Despite having a large volume orebody lying virtually at surface, no geophysical techniques were successful in "seeing" the orebody. Geophysics was abandoned, and exploration of the surrounding area proceeded by the only available option, - stepout drilling.
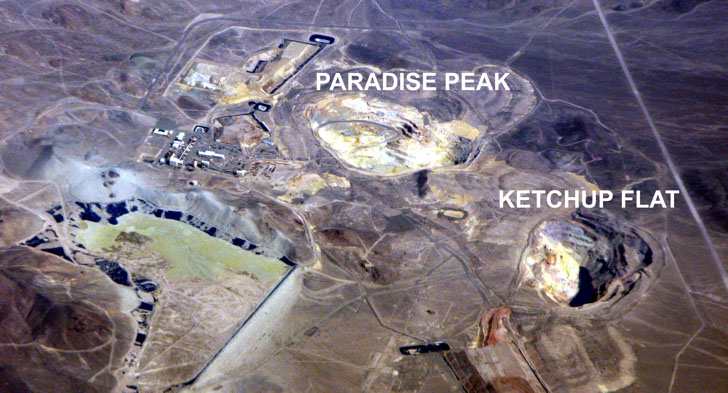
Five years of continuous exploration drilling brought results: the Ketchup Flat orebody, hidden from view all that time by just a couple of metres of cover. At about the time that the Ketchup Flat orebody was being stripped for mining, FMC heard about E-SCAN, and brought it in for a test that included the operating Paradise Peak deposit site, and the new Ketchup Flat discovery. Premier Geophysics applied E-SCAN on a 300 foot square grid spacing to generate one of the first true 3D DC resistivity field data sets ever acquired in Nevada. These field data were processed some time later with the first DC resistivity 3D inversion program, developed with FMC's co-operation at the University of British Columbia.
This is what was seen as a result of the 3-week field survey, followed by 3D inversion processing:
plan views, at absolute elevations | | plan views, draped on topo | | section views facing Southeast | | section views facing Northeast
Additional controls are embedded in the displays - you can speed through by clicking on either the left or right third. For pause and resume, click anywhere in the middle.