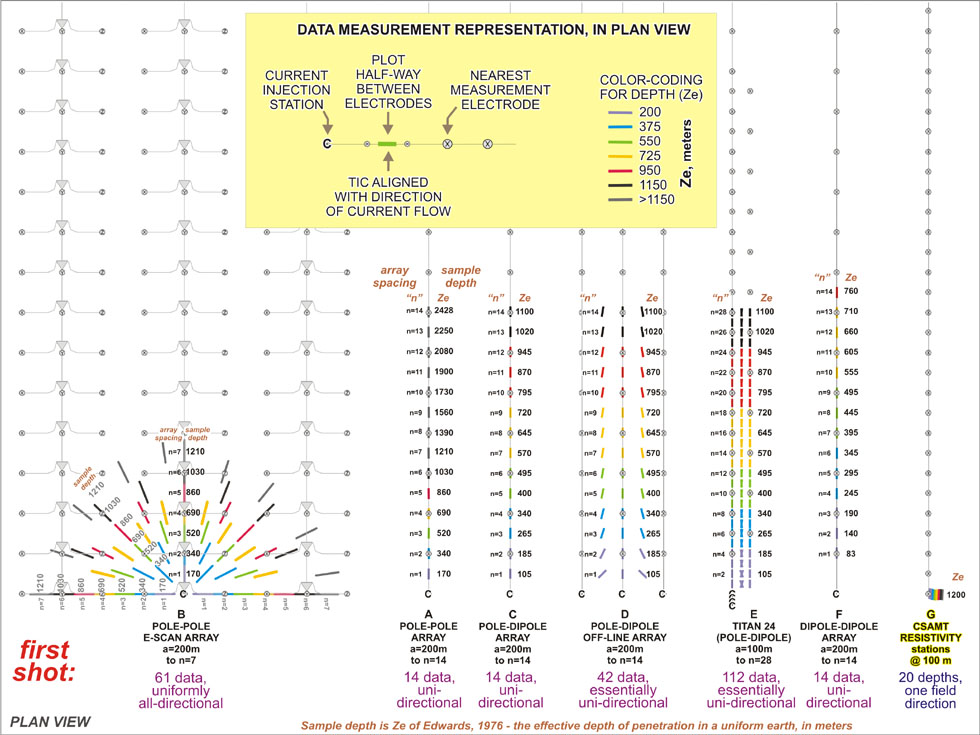
Figure 1: Current is injected at the first station of the first line of the survey grid, for six types of DC IP/resistivity field surveys.
Also shown is a line of CSAMT resistivity stations, measuring a single orientation field originating from a single distant source.
Ten shots down the survey line
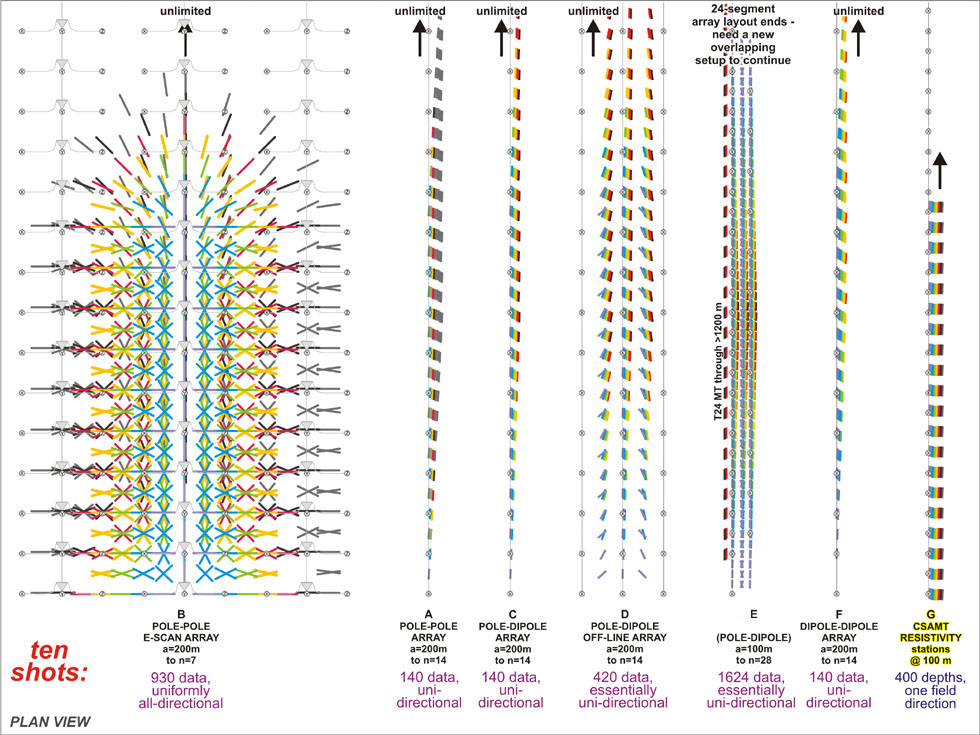
Figure 2: The data acquired after current has been advanced ten stations down a line.
Completed survey: the acquired data set.
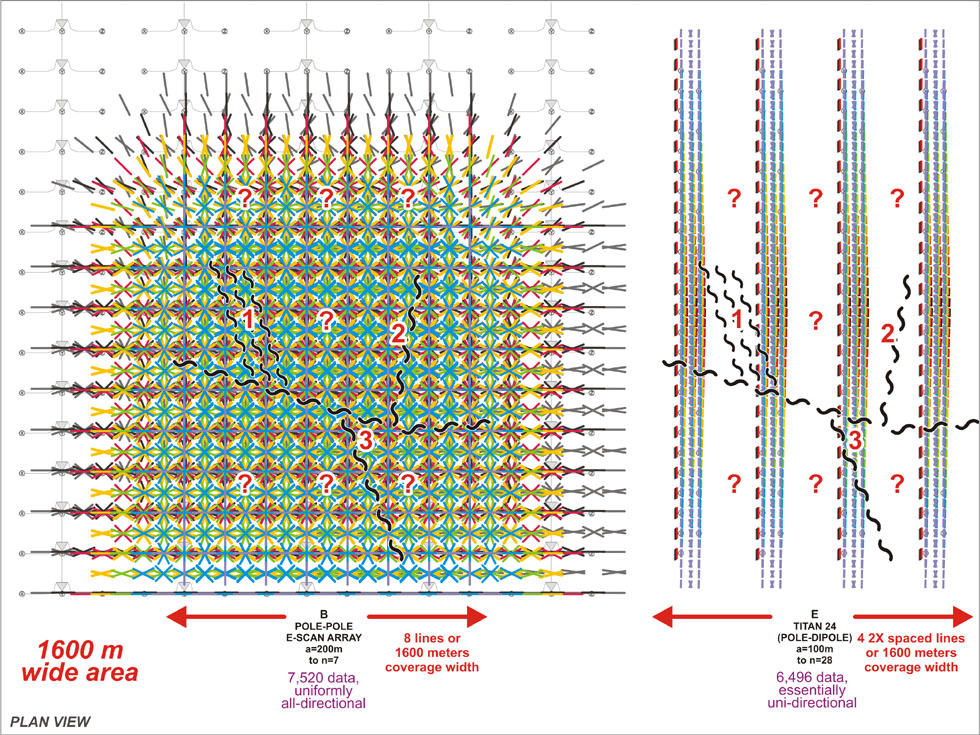
Figure 3: Typical completed-survey field data sets, ready for constraint of 3D inversion modeling.
TITAN-24 survey data are shown at right; other collinear surveys will show similar adjacent lines of data (per Figure 2, above)
spread across the survey area. A true 3D survey application respects the possibility that various unknown possibilities may
exist, as exemplified by the overprinted deep structural pattern. While both of the above survey data sets will support imaging
of the predicted east-west (left-right) structure and/or anomalous body orientation, any unexpected cross-breaking structure and
anomalous bodies oriented north-south will be mapped with equal objectivity only by an all-directional data set, example at left.
TITAN-24's true 3D equivalent technology, ORION 3D, can deliver all-directional 3D data sets that look similar to those shown at left.
A point-by-point comparison of 3D E-SCAN and ORION 3D methods, costs, and limitations can be reviewed: click here.