 It is easy to overestimate the influence of buried and surface infrastructure associated with a town or village.
 In the first place, the mapping and evaluation of the area lying under the settlement is the least-affected part of the field data set, with all but the shallowest data obtained from sets of electrodes located outside of the inhabited area, nowhere near the near-surface installed infrastructure.
Second, the infrastructure itself is largely non-reactive. There may be some grounded metal pipe, but this is rare in most cases,- plastic and concrete see far wider use in water and sewer installations, and neither material is conductive. Grounded electric circuits are no more onerous than they would be in an industrial minesite, perhaps less so, and in any case subject to the powerful data-verification and error-trapping procedures inherent in the dense 3D E-SCAN data set for the few data that actually originate from electrodes in the town area, near such installations.
Finally, if all of this still leaves questions in the client's mind, the 3D field data set can be culled of all electrode sites and all measured data even remotely associated with in-town locations, physically avoiding infrastructure installations, and the remaining data objectively inversion-processed. The pattern of earth resistivity near and beneath the town should continue to be displayed, with little difference, in the new 3D inversion results,- the imagery based on the massive number distant-sourced measurements that sample beneath the town and all of its near-surface installations. No more stringent examination than this could be asked for. This test is a routinely available option for any situation in which a 3D E-SCAN client experiences uncertainty with any pattern of results, and may value such empirical comfort over (or along with) any technical explanations.
In the case of a close coincidence between the location of potentially important anomaly indications and a townsite, such as here, the confirmation testing may be applied automatically as part of the data evaluation process.
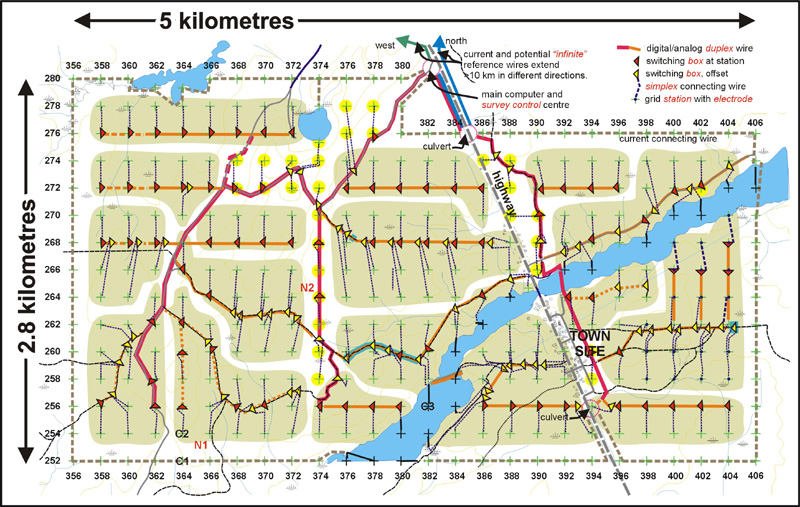
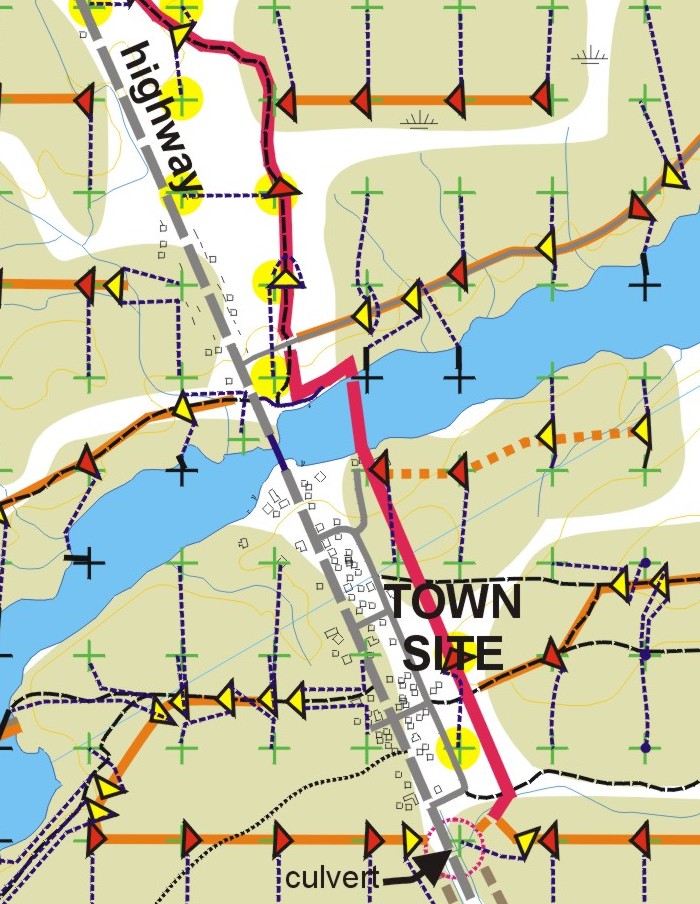
The town in this survey area did indeed provoke client concerns about the possible contribution of the town infrastructure to the anomaly that lies directly below, aligned with the town, the bridge over the river, and the extension of the highway to the north-northwest. The data-exclusion test demonstrated no such influence, leaving the client free to speculate on the causes for the river's location, for the naturally-occurring narrowing of the river (which site was selected for the bridge for obvious engineering reasons), and the coincidence of the deep anomaly orientation with the logical straight highway approach and departure to/from the bridge.
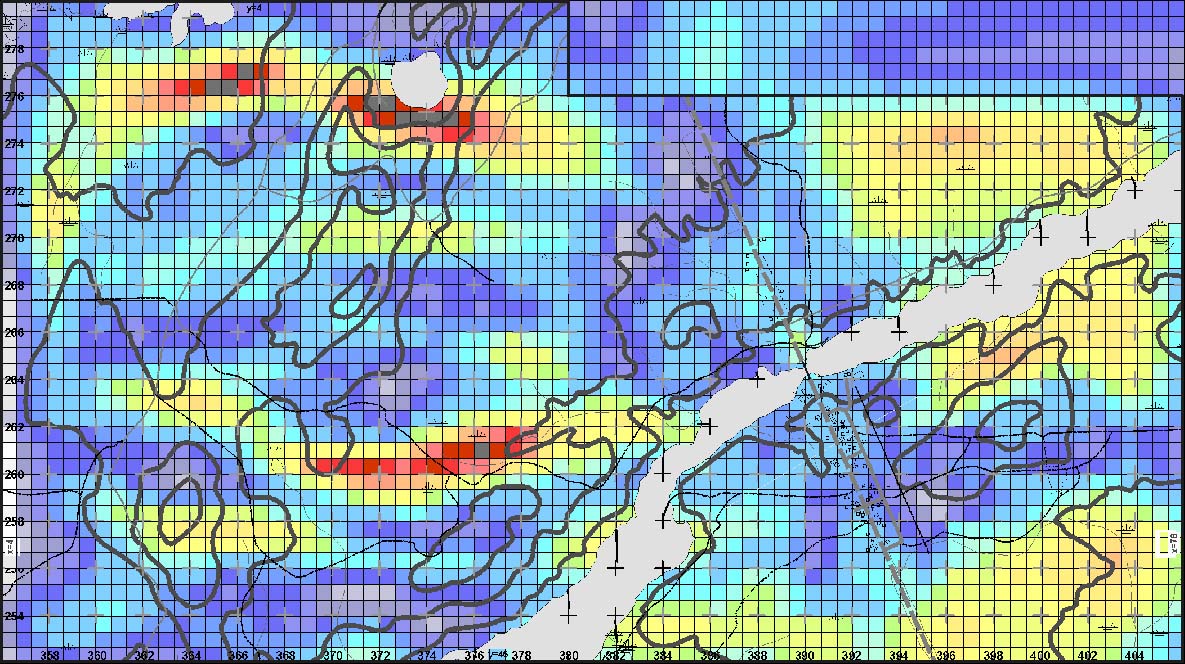
Note in the image that the town/highway system is not the only feature associated with the location of the anomaly. In this steeply-dipping Archean sequence, the rocks on the west (left) side of the image are extremely resistive, around 50,000 ohm-metres, while those on the east side (right) are closer to 5,000 ohm-metres. Clearly there is a major geological contact or transition in the vicinity of the deep anomaly (coincidentally beneath the non-reactive paved highway surface).
Bottom line: If a survey area of interest includes a townsite (perhaps the mine's own housing area?) and assorted commercial/industrial areas, 3d E-SCAN will provide continuous valid 3D subsurface imagery right through the area to provide the uninterrupted area-wide geo-electric context needed to properly assess local resource potential. If a deposit lies directly under the townsite, its anomaly pattern will be mapped with a data set that can support testing and verification of all subsequent questions of possible infrastructure interference and basic data validity.
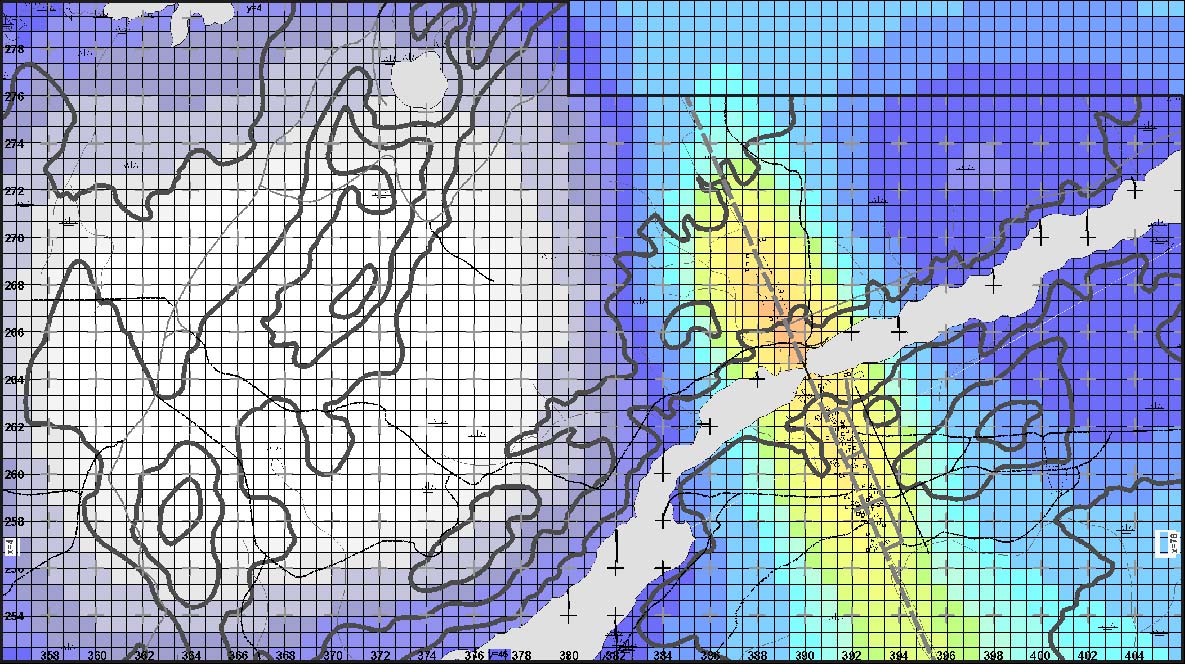 20 metres below surface, there is no sign of any anomaly near or under the town or highway. In fact, that area is quieter than the surrounding areas.