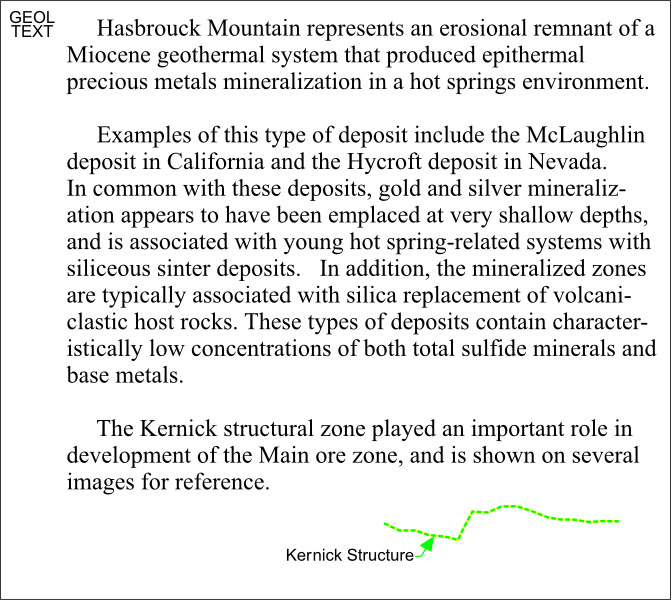
Hasbrouck Peak, Esmeralda County, Nevada
NOTE: This discussion uses dated information that has been subsequently revised and reported via proper NI-43-101 filings. This is a discussion of a general exploration strategy only, and no opinions on the current status of the resource are offered.
The best possible application of exploration geophysics is surely one which consists of looking for repeat examples of an established local resource signature. "The on-site resource looks like this, so let's look for more of the same, nearby."
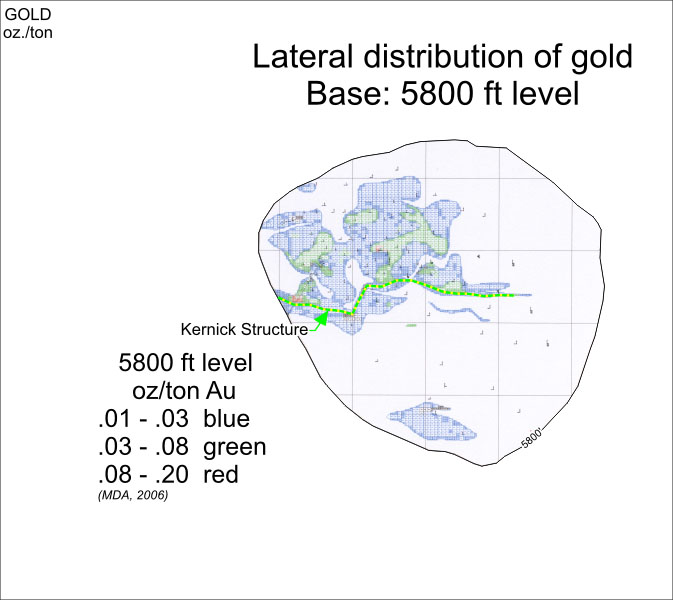
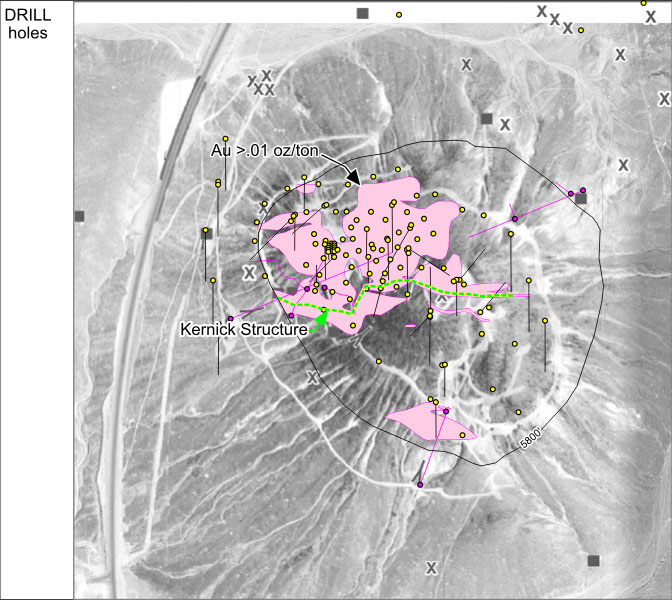
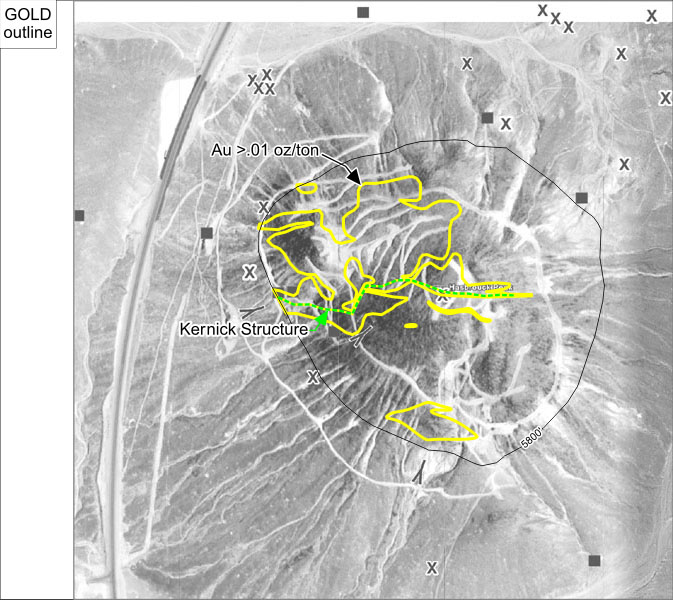
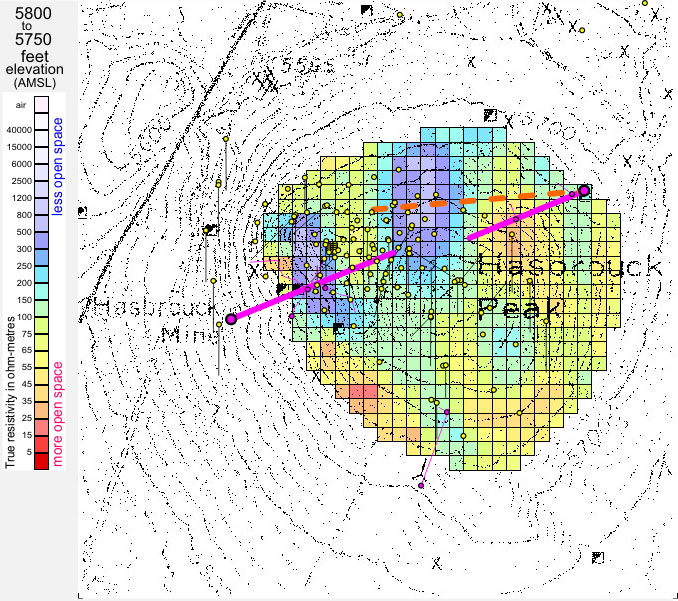
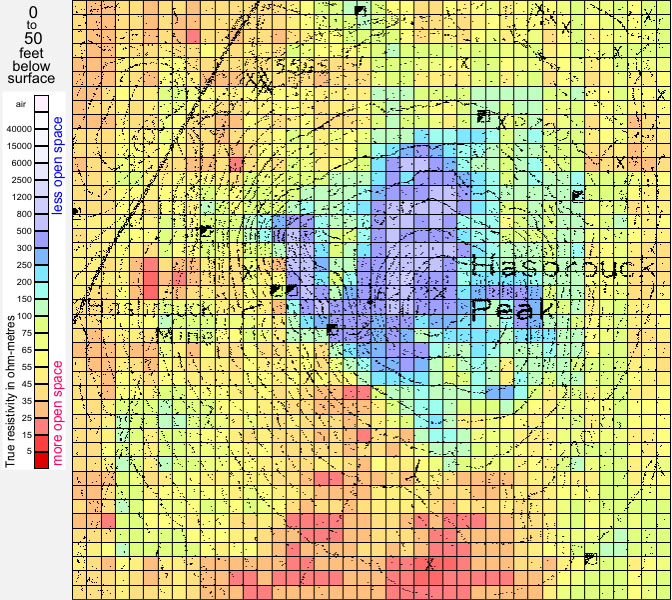
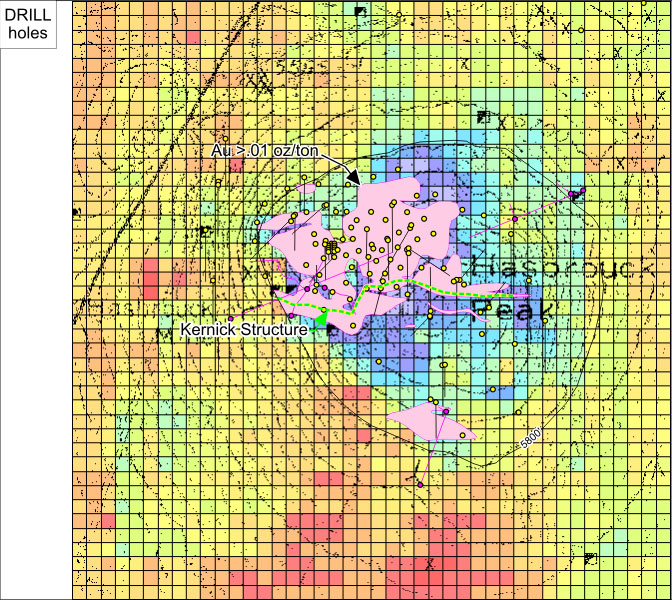
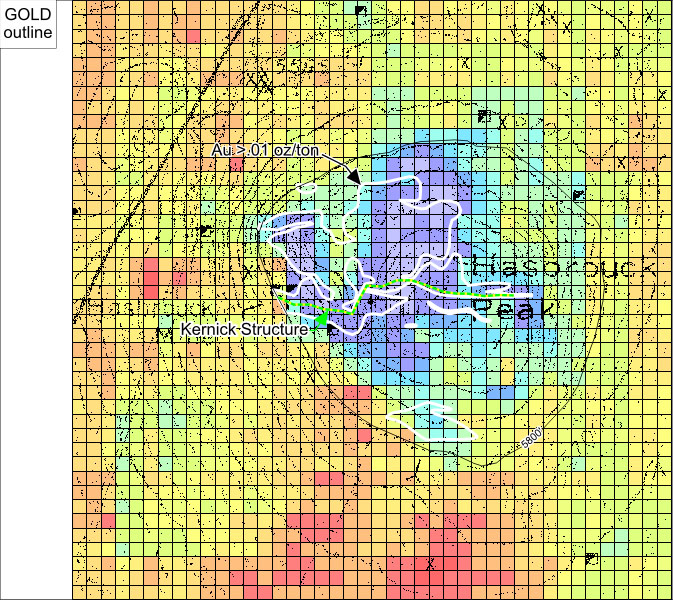
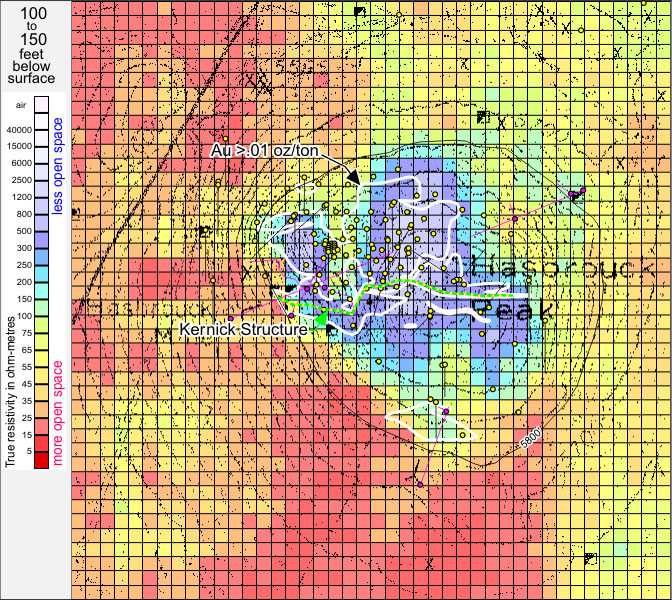
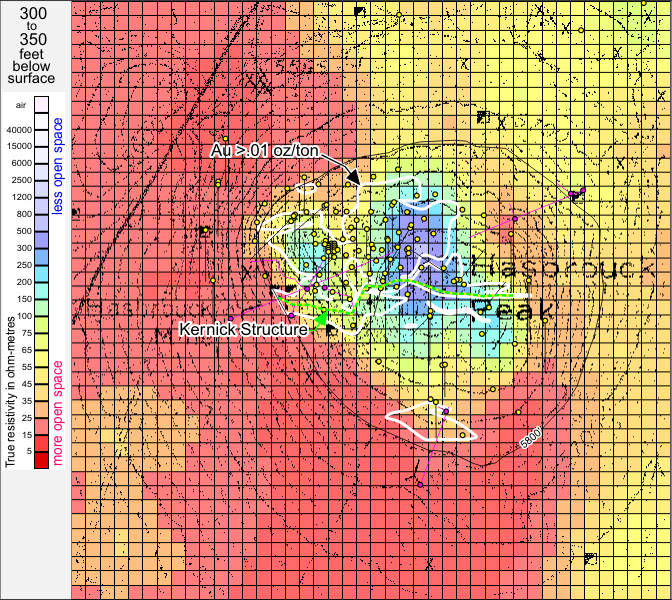
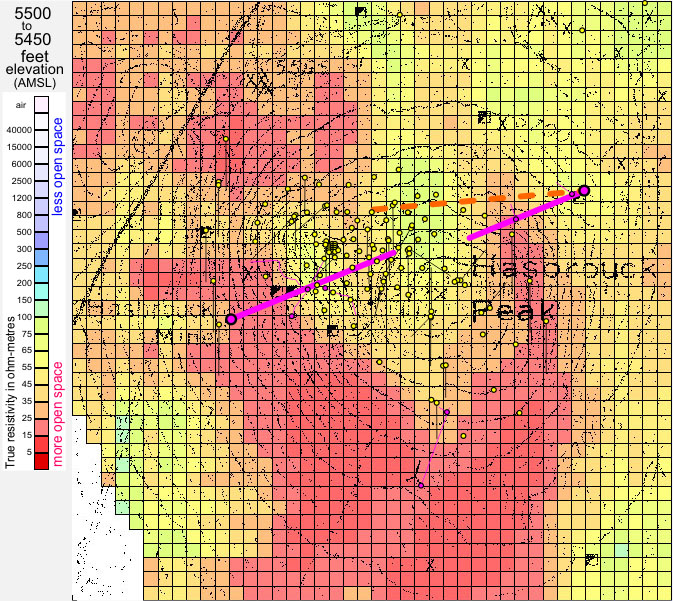
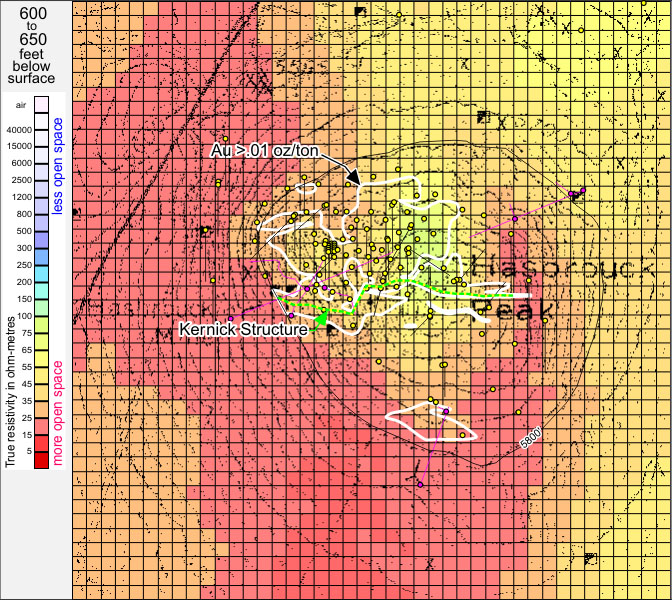
Hasbrouck Peak, to date, exhibits a one-to-one relationship between gold deposition and silicification. Virtually all gold intercepts lie within resistivity anomalies. This suggests that all remaining untested areas of indicated silicification (3D resistivity anomalous areas) should be tested for the presence of gold values. On a district exploration scale, it also presents a useful example of one of the recognizable signatures that any wider-area resistivity survey coverage should seek.
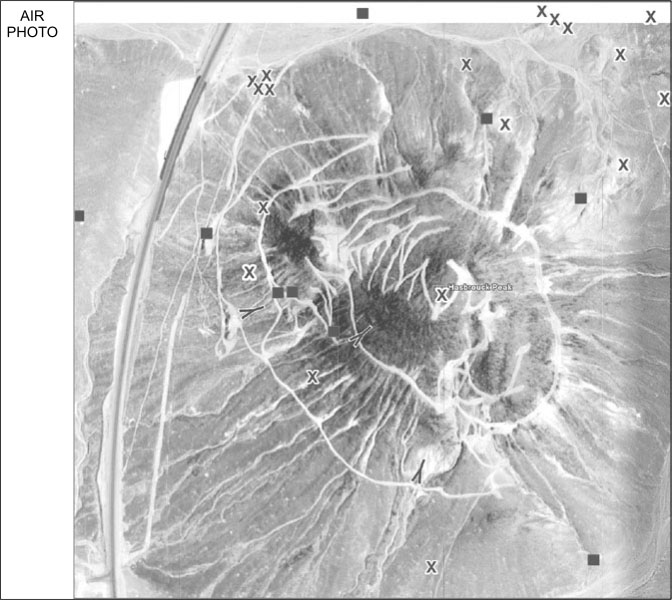
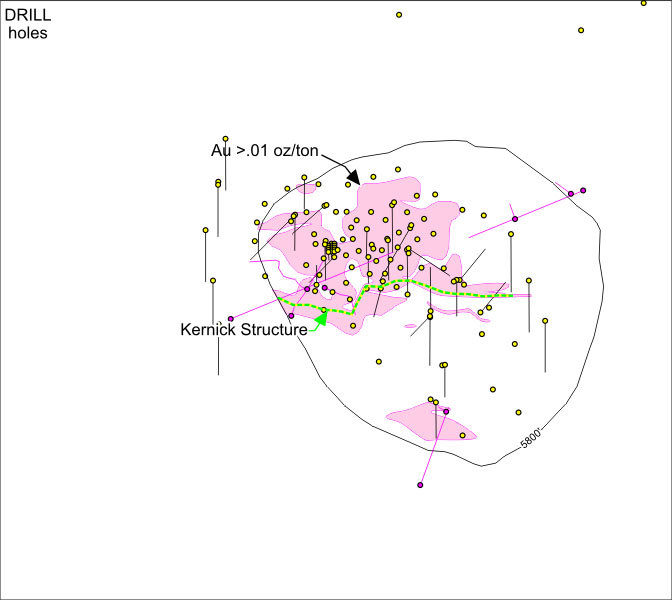
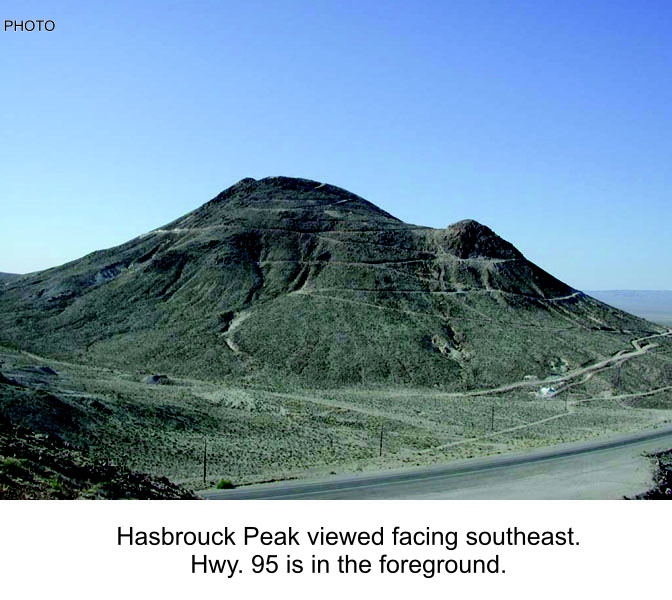
The majority of economic gold values (images 4-7, trigger larger views at right) occur on the north-facing side of Hasbrouck Peak (image 1), but not all of them. There is a zone of drilled-off silica-gold mineralization on the south flank. In 2006, several geophysically-indicated (resistive) target zones remained undrilled, as seen in image 10 where substantial zones of elevated resistivity (indicating silicification) show no drill test activity. This may have changed as exploration drilling has continued since 2006. The point is to show how a known geophysical correlation can lead to the drill testing of additional target zones where there may be no other indications.
This set of images illustrates the remarkable correlation between established gold mineralization zones and the detailed resistivity patterns mapped out by the 1989 3D resistivity survey. Two sets of annotated plan-view images are also available for review by clicking on the "to plan views..." areas at top-left of this page. The two sets of section images are in preparation, and will be available soon in a format similar to that used in displaying the true vertical sections at Paradise Peak.
These data indicate a near-zero IP response within the resistivity-indicated areas of silicification, and a very low general background IP response for the surrounding volcanics within which the resistive (silicified) areas reside. The near-zero values within the resistive anomaly areas are attributed to the effective electrical isolation of sulfides by silica encapsulation.
The acquired IP data set provides no justification for the use of higher-cost IP surveys in this immediate area, given that the demonstrated correlation of the resistive anomaly pattern with gold mineralization provides for all necessary drill targeting.