A slide show explains
the True 3D data set
vs E-SCAN's strongest competitive method.
The
one-picture summary.
E-SCAN® 3D earth geo-electric mapping
GREENFIELDS and BROWNFIELDS
TECHNICAL REFERENCE
(continuing in preparation 2019)
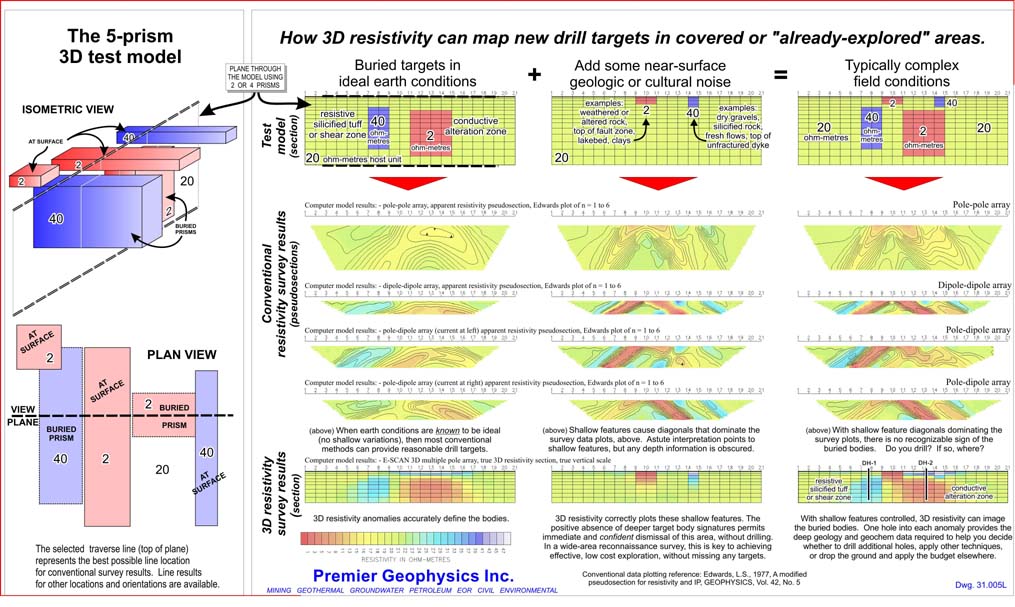
5-prism
3D earth
test model

download
OPERATING IN DIFFICULT TERRAIN AND WEATHER CONDITIONS
- steep
terrain
- cliffs
- rivers
streams
- remote
areas
- desert,
caliche
- extreme
altitudes
- lakes,
swamps
- frozen
lakes
- island
settings
- thick
bush
- cold
weather
- hot
weather
- wet
weather
Steep terrain
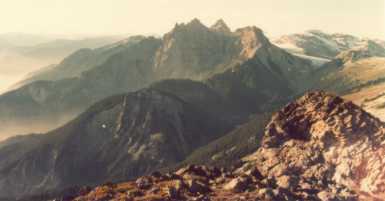
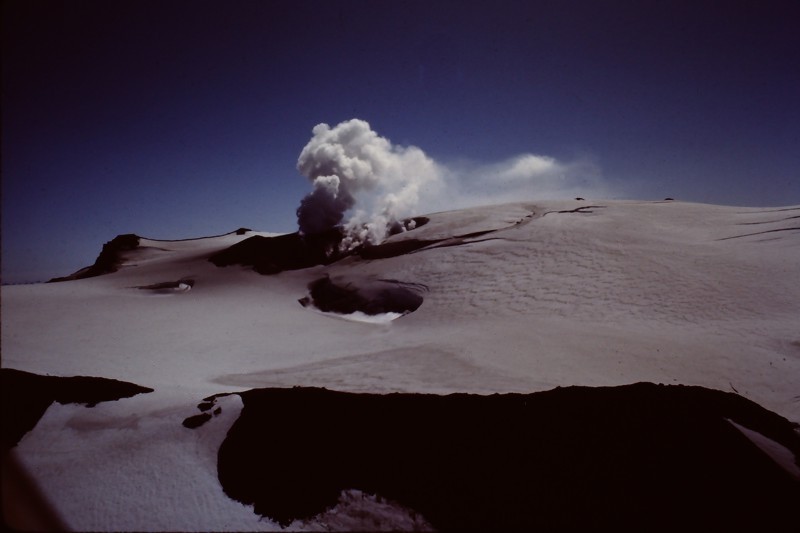
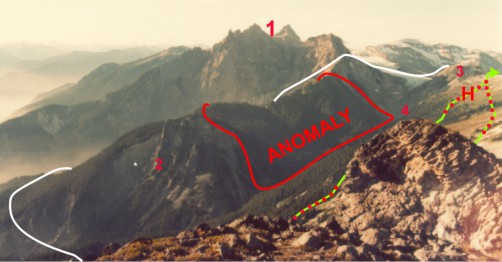
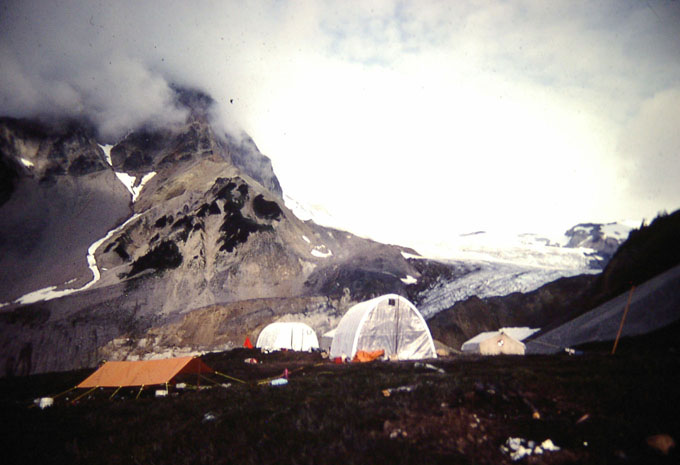
The largest stratovolcano in the northern Cascades, Mt. Cayley, dominates the landscape in the crystalline Coast Range mountains, near Whistler, British Columbia.
The 3D E-SCAN system and supplies, plus an entire camp were flown onto the mountain for a geothermal energy survey.
The survey, conducted for the
Geological Survey of Canada (a principal co-funder
of E-SCAN research), was required to resolve an ambiguous result from a reconnaissance dipole-dipole array survey that supported
11 different plausible conductive anomaly sites. It did so, while completing this debut 3D E-SCAN survey on time and on budget.
Time, cost, risk?
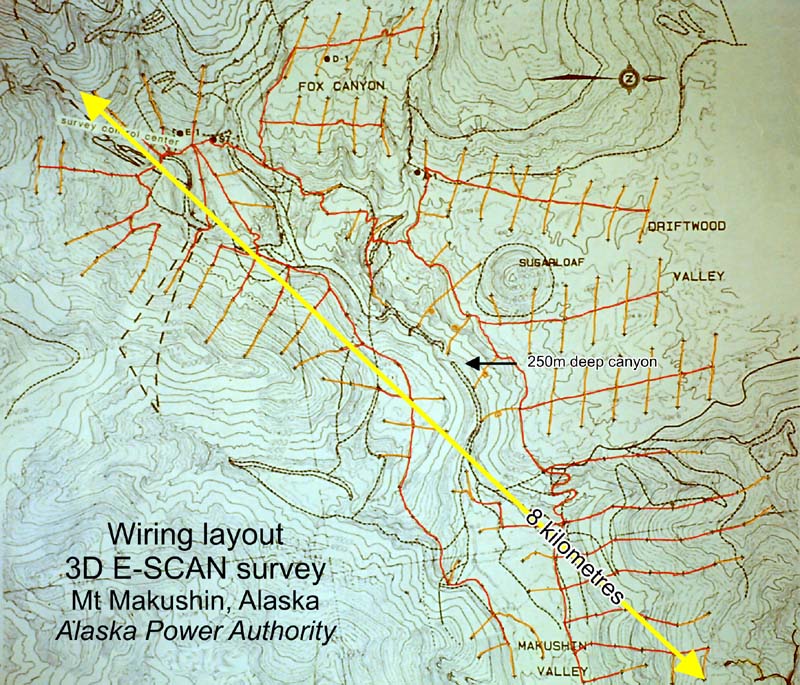
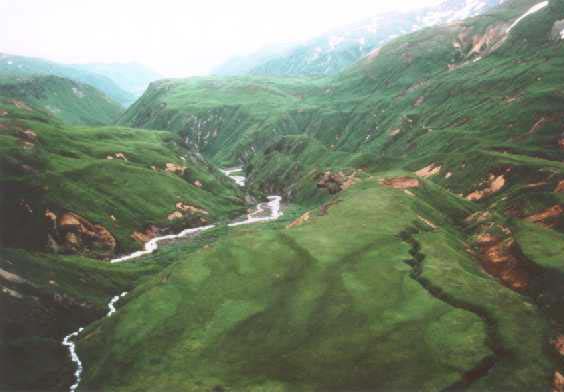 A program of geothermal exploration was conducted on Mt. Makushin, Unalaska Island, Alaska for the Alaska Power Authority.
Conventional electrical surveys could not be operated where they were needed in this terrain. At right is the field wiring diagram for a
3D E-SCAN survey over 26 square kilometres of the lower slopes of the volcano.
Long before viable hand-held GPS became available, 3D E-SCAN crews navigated in this extreme terrain using air photos to
lock on to individual boulders and creek bends, chaining distances with lost-thread and pre-measured spools of wire. Grid stations are 1000 feet (300m)
apart along wire routes.
The single lines descending the steeper slopes indicate where wiring traverses originated from a ridgetop helicopter drop.
Where there are stations thrown right and left from a central wire, terrain is more easily walkable in all directions.
The wiring effort paid off. Working where conventional electrical survey coverage was not possible, 3D E-SCAN acquired a
dense, evenly-spaced, multi-directional raw data set.
Interpretation of these data provided a firm answer to the key exploration question: does the known geothermal system
extend down-valley into the presently road-accessible areas, or do we have
to spend millions on bridge and road construction in order to get into the productive area?
Time, cost, risk?
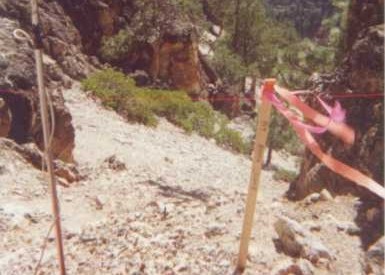
This square-mile 3D E-SCAN survey targeted gold-silver in an intrusive host. The setting is the Sierra Nevada, south of Lake Tahoe, California.
Once again, extreme terrain is easily handled by the ultra-flexible layout capabilities of the 3D E-SCAN system.
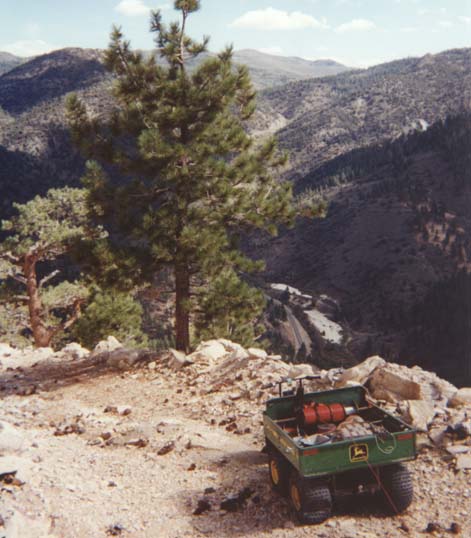
This five-wheeler positioned caches of wire and electrodes on the few drill roads circling the top of the hill.
Drawing supplies from these caches, field crew laid the wire and electrode stations downslope by hand, using GPS guidance.
An ATV would bring the crew back to the top area for the next run.
As usual, all electrode installation locations are recorded in three dimensions, and represented in the topographically-correct 3D
inversion mesh for processing. In true 3D operations, there are no "topographic corrections" of the type we are familiar with in trying
to interpret conventional collinear array data in rough terrain.
Time, cost, risk?
back to top of this page
Cliffs, canyons and other steep impediments
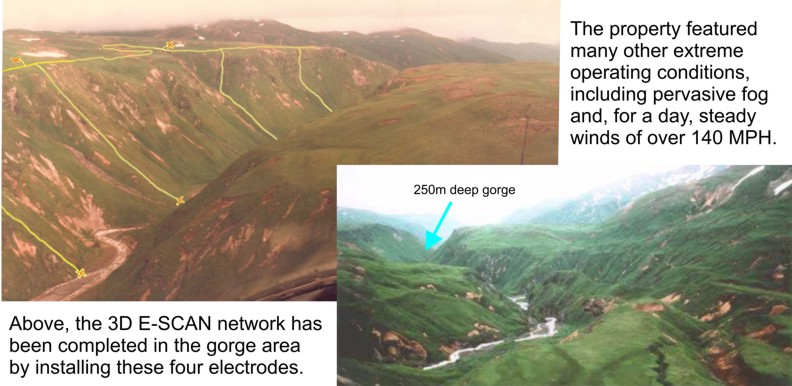


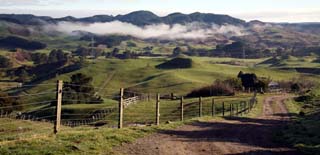
 On Makushin Volcano, Aleutian Islands, Alaska, the scale of terrain variations is very large.
The 250 metre deep canyon of the Makushin River, seen in the upper left part of this photo, had to be included in the continuous 3D survey coverage,
in order to evaluate the possibility that it marked the surface trace of a structural zone aligned deep below it.
The wire layout map shows the strategic central location of the four electrode stations in the deep canyon.
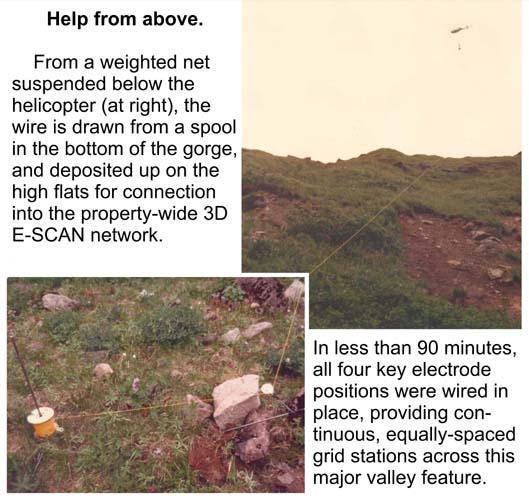
Each of the four orange connecting wires is marked by a loop indicating that those stations were installed with direct helicopter help.
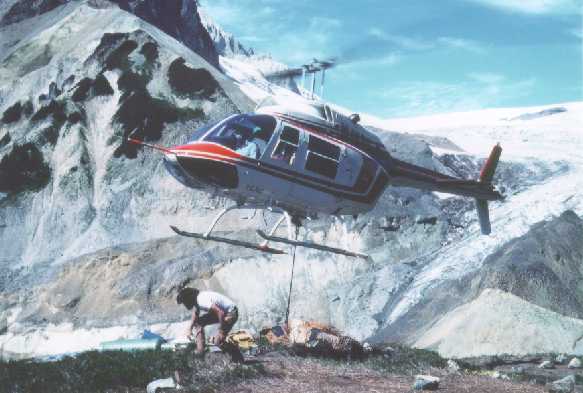
A crew person was dropped beside the river to set up a simple wire deploying system with a spool and pulley.
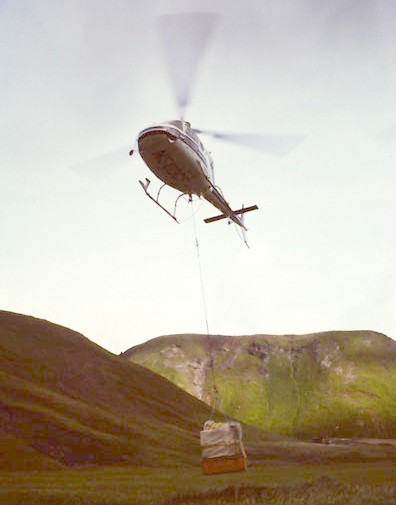
A heavy sling load (in this case a few hundred pounds of driller's hose) is suspended on a "long line" far below the helicopter,
and the wire is attached to it. The weight keeps the wire steadily positioned well below the helicopter's vulnerable main- and tail-rotors, even
in gusty winds or in the always-possible event that the wire dispensing spool jams and the wire tightens, breaks, and recoils upward.
The wire is lifted to the upper canyon deck while the crew person maintains gentle and steady wire tension by damping the spool.
The entire operation is completed in less than twenty minutes per wire. The uninterrupted survey grid installation is complete,
and raw data continuity is secured.
On a smaller scale, cliffs that interrupt the easy traverse of a property are usually managed without helicopter help.
A wire is run up or down a selected safe route (or thrown down from the top) to connect a survey grid system laid separately to cover the other side of the vertical obstacle.
The resulting field data set flows uninterrupted across the structure, yielding true 3D raw data as if the obstacle did not exist.
If the cliff marks the location of structure and possible mineralization activity, these will be accurately represented in the 3D earth model, regardless of the shape,
orientation or depth of the geo-electric features and anomalies that are present.
PUT CCKa PHOENIX EXAMPLE HERE. PUT INTRO-TICS IMAGERY HERE. gas08April
back to top of this page
Rivers and streams
A river or river canyon should never limit raw data acquisition...
often it is a sign of potentially-important structure beneath.
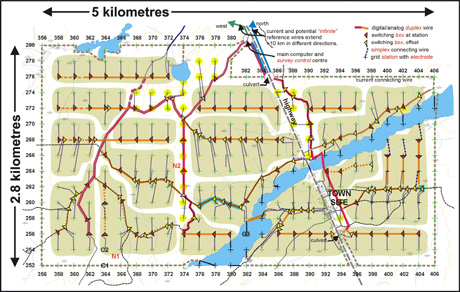
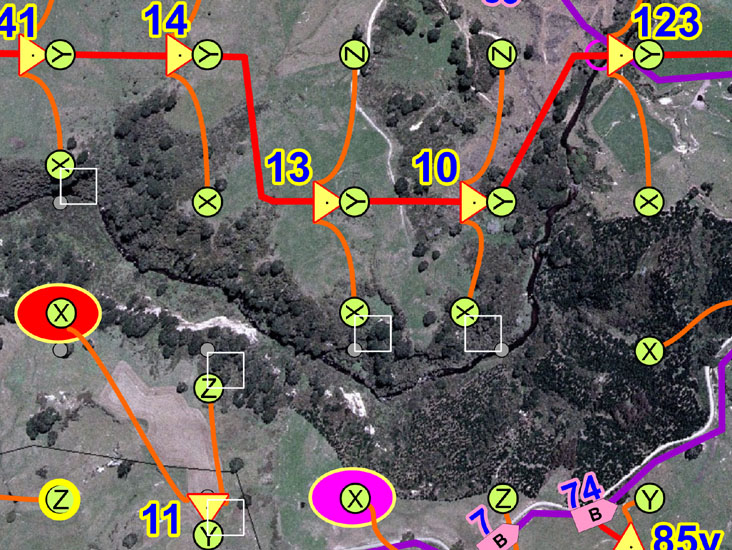
Right Here is the actual field wiring diagram for a
3D E-SCAN survey (Quebec, 1999) where a river cuts the property, and possibly marks an
underlying structure of exploration interest.
18 electrode stations were placed in the river-bottom from a GPS-positioned boat,
then wired in to the land-based electronics network to complete the uniform grid spacing.
This maintains perfect continuity in the true 3D field data set
(uniform distribution, high density, and multi-directional data set characteristics), as if the river wasn't there.
Conventional traverse surveys would tend to be run parallel to the river to
avoid frequent crossing delays and complications, but this would further limit the already-sparse raw
data set in terms of proper investigation of possible linear structure under the river.
Time, cost, risk?
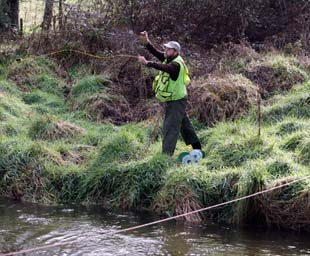
Not all rivers are wide enough to require a boat and river-bottom electrodes. Many of the rivers and streams on properties
surveyed by 3D E-SCAN in New Zealand were too deep to walk across, but narrow enough in places that wire could be
thrown by hand to the other side .
Then the survey area on the other side could be wired and shot independently to complete the unbroken survey grid coverage.
If an electrode station is required in mid-stream, the choice may be to install
it at
an offset equal to 1/4 of the nominal grid spacing.
At right, Ernie Holbek is winging the second wire across the river at 123Y (upper right on the layout map).
Time, cost, risk?
Remote areas
E-SCAN instrumentation can be shipped by last-minute commercial air freight to meet up with the several tons of wire and electrodes
that may have been shipped, using lower-cost surface methods, weeks or even months in advance of the startup date.
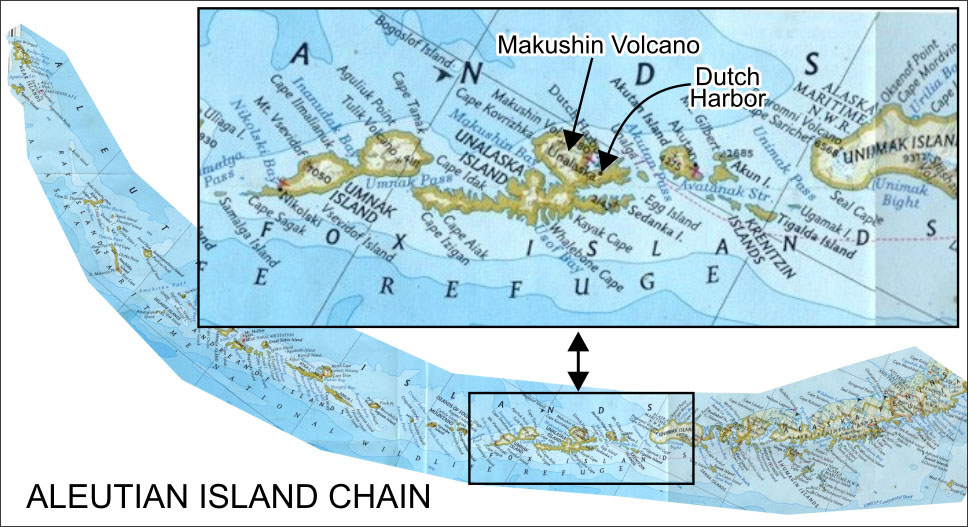
Example: The 3D E-SCAN geothermal mapping survey on Mt. Makushin, Unalaska Island, in the Aleutian chain, exemplified remote application of E-SCAN.
Electronics arrived by air freight to Dutch Harbor airport. The heaviest supplies - wire and electrodes - were shipped in advance by ocean
freighter from Seattle. Several tons of wire and survey equipment was lifted by helicopter directly from the deck of the freighter in
Dutch Harbor, and then flown to the work site on the
flank of Makushin Volcano. Seven round trips were needed. On completion, all wire and equipment was flown back out, leaving the survey area clean and unaffected.
Example: Work in New Zealand involved air shipment of about 1000 kilograms of instrumentation. A 20 foot shipping container of wire was shipped from
New Jersey, USA via Panama Canal for arrival in Wellington close to the planned survey start-up date.
Example: A project near the north coast of Canada involved shipping everything (wire, instrumentation, electrodes) at once.
The shipment went by truck to Yellowknife, Northwest Territories. A De Havilland Twin Otter float plane then flew the instrumentation and wire to the lakeside
exploration camp above the Arctic Circle, with a refuelling stop at Lupin. Final placement of some of the supplies on the working site was done by helicopter.
Remote operation means double-checked planning and expediting, with sufficient advance timing.
Even where regularly-scheduled commercial shipping is available, customs clearance can become the biggest single slowdown issue at
some ports of entry, such as Mexico, requiring appropriate planning and advance shipping strategies to avoid extra costs and sometimes-systemic delays.
Desert and (hard) caliche conditions
3D E-SCAN's almost 100-times better signal performance (per unit of current injected) means that getting sufficient ground contact
for current injection is that much easier than for conventional survey electrode installations. Often, no extra electrode measures
are needed in establishing sufficient contact in areas where
conventional surveys have failed.
Conventional surveys sometimes have to resort to digging pits for burying metal foil (with many litres of salt water) in order to
get enough current into the ground. No 3D E-SCAN survey conducted to date has needed more than two steel stakes (with a litre of salt water),
never more than 3 amperes of current, to achieve full signal quality at the desired depths of investigation.
Even where the brute power of E-SCAN's 7.5 kilowatt transmitter is needed to drive a ragged current into extra-dry conditions,
special waveform synchronization manages the
irregular waveform shapes caused by partially
arc-delivered current, ensuring no loss of measured data integrity.
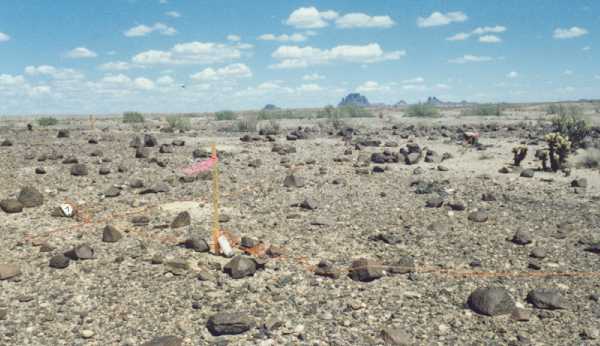
Above: July in southeast California and southwest Arizona gets very hot in July. While the 3D E-SCAN
equipment is not affected by high temperatures, this 3D survey had to be operated on some days between 2 A.M. and 9 A.M. to avoid
daytime air temperatures of more than 60 degrees C. Low in the distance: peaks of the Chocolate Mountains.
No vehicles were permitted off-road on this site, meaning that the heavy manual labor of laying wire and installing electrodes
(and recovering it all, later) was done by hardy individuals with big canteens.
Time, cost, risk?
Environmental advantage: The ban on vehicles here was part of a set of severe operating restrictions placed
on the E-SCAN crew by the US Bureau of Land Management (BLM) El Centro office, as part of permission to work in this restricted
preserve for desert tortoises. The El Centro BLM people reacted positively to the gentle nature of the proposed 3D E-SCAN survey
operation (no electrode pits, no surface disturbance), coupled with the downstream advantage of needing a reduced number of drill
pads from which to complete effective exploration of the area.
"Hot/dry" technology: At these high desert temperatures, keeping several hundred electrodes watered to preserve contact is a serious issue...
quality results depend upon it. Even with plastic evaporation barriers and the benefits of salt in maintaining sufficient moisture, an occasional
electrode will dry to the point where its contact resistance seriously affects data acquired at that site.
3D E-SCAN control software has a proprietary electrode contact management sub-program that can routinely evaluate contact resistance at every
electrode across the entire grid, without causing the serious disruptions typical of simple ohm-meter resistance checks.
Electrode sites needing a shot of water are flagged and reported for crew action.
Better still, while waiting for such sites
to be watered later in the day, the program can actually measure the undisturbed effective impedance
of the electrode under millivolt signal conditions, to allow acquisition of a fully corrected measurement from the dry-contact electrode.
This is an example of the depth of system management technology that is required to keep 3D E-SCAN producing verifiable quality results,
uninterrupted, in virtually any terrain conditions on earth. It's a benefit of having over a quarter-century of accumulated technological development
and hands-on field experience in large scale (hundreds of electrodes) system operation and management.
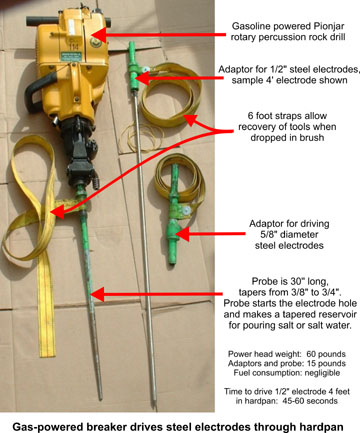
Left: Special equipment Hard desert soil conditions can make summer electrode installation as difficult as dealing with -40 degree
frozen ground. A Pionjar "plugger" is adapted to drive 1/2 inch and 5/8 inch (13, 16 mm) stainless steel electrodes into the hard ground.
All of the smaller adapters and tools have colorful tethers attached so that when they are dropped, they remain easy to locate.
Should deeper penetration be needed, Premier also has a 2-man Vibra-Core soil drill rigged up with electrode
adapters, on an ATV, with a capability of driving an electrode even deeper, e.g. for current delivery below a hard, electrically
resistant caliche layer.
back to top of this page
Extreme altitude
Key issues (apart from reduced human performance expectations) at and above 12,000 feet elevation are
related to the operation of vehicles, including survey ATV's, and various gas-engine survey equipment such as generators and wire re-winders.
Engines with electronic fuel injection (EFI) have the best chance of normal operation, though non-turbocharged engines must be de-rated by about
50% at 12,000 feet (and a further 4% per additional 1000 feet above that). Premier's 20 horsepower geophysical generator would be rated at
10 HP at 12,000 feet, still sufficient to power any 3D E-SCAN survey, and its EFI fuel management eliminates carburetor jet issues.
Premier's newer Polaris ATV's are EFI fueled, and are sufficiently overpowered at sea level that viability at 12,000 to 15,000 feet
elevation is expected.
Local client information and advice will be important in planning and executing high elevation surveys,
with any high-elevation minesite's experience with powered equipment being the best source of information for locally-available, proven-functional generators and vehicles.
back to top of this page
Lakes and swamps
In some areas, there is more lake than land.
Continuity of 3D exploration imaging both on- and off-shore is
essential for understanding the subsurface exploration setting.

Archean terrain "North of 60"
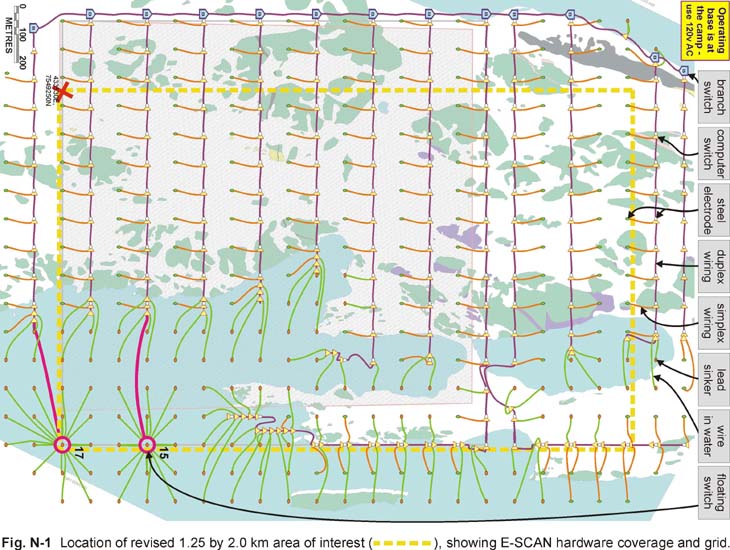
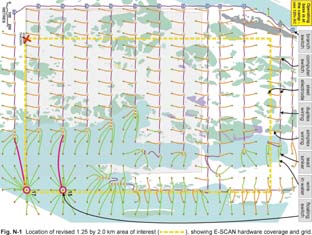
At right is the actual field wiring diagram for a 3D E-SCAN survey north of the Arctic Circle, where lakes occupy a large portion of the study area.
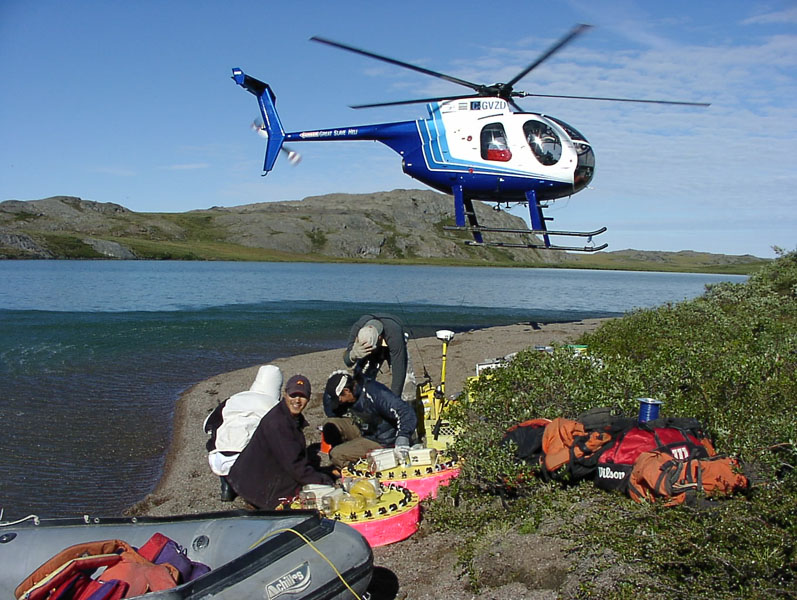
Many individual grid stations were installed from the GPS-equipped inflatable boat, by pulling a wire from shore to the grid position where an attached
metal fishing weight was lowered to lake bottom to serve as an electrode contact.
In the wider area of the lake, two floating hubs provided access to a total of 32 lake-bottom electrodes sites.
Each hub employed a master duplex signal wire connected to the main grid wiring network on shore, and a separate current feeder wire.
 The extremely fast shooting of these 32 mid-lake stations made up most of the extra time required to position and install the floating base electrodes by boat.
On this project, the client's exploration schedule could not accommodate a winter through-ice E-SCAN survey.
The water-grid installation maintained perfect grid-spacing continuity in the true 3D field data set (uniform distribution, high density,
and multi-directional data set characteristics), as if the lake wasn't there.
Time, cost, risk?

Northern Canada"Diamonds"
At right is an example of how 3D E-SCAN would wire a depression suspected of being the site of a buried kimberlite pipe.
In winter, the frozen surface would allow on-ice wiring and through-ice,
pond-bottom electrode installation using 3D (pond-bottom) coordinates.
Time, cost, risk?
Frozen lakes
In some areas, there is more lake than land.
Continuity of 3D exploration imaging both on- and off-shore is
essential for understanding the subsurface exploration setting.
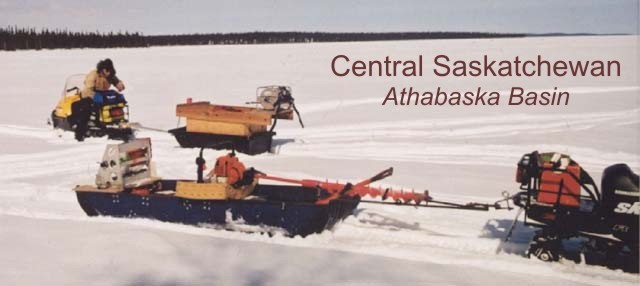
Central Saskatchewan
"Athabasca Basin"
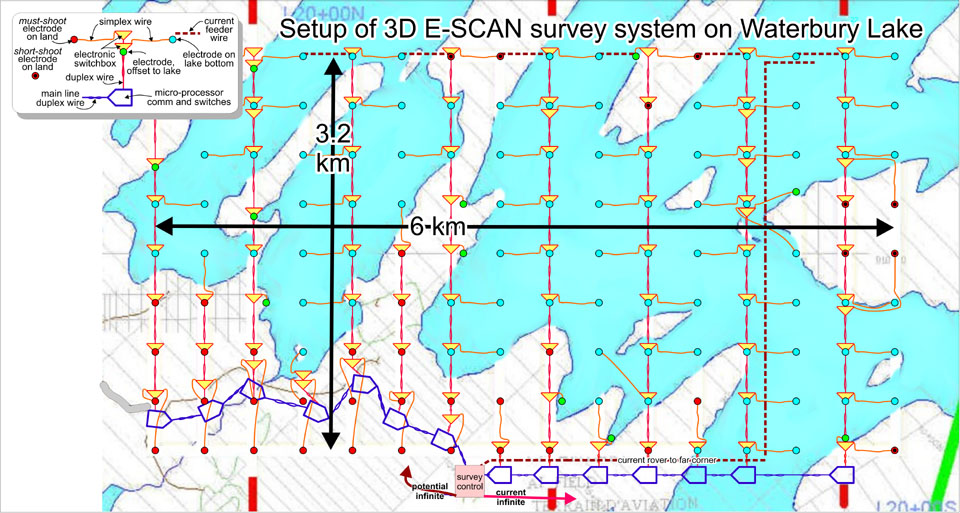
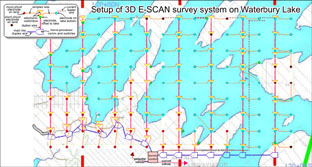
Above is the field wiring diagram for a 3D E-SCAN survey to test resolution of unconformity uranium target features,
in an area dominated by Waterbury Lake. Year-round road-accessible infrastructure at the nearby Cigar Lake mine helped
to make this an easy "in winter" choice for survey timing. Snowmobiles traversed the lake with GPS guidance, to install
and wire the electrode stations on the 400 metre spaced survey grid.
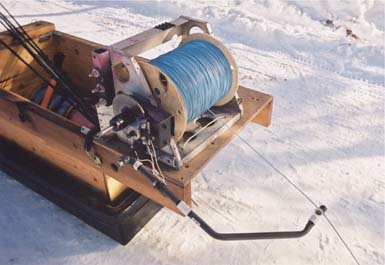
High-speed wire deployment from disc-braked , damped spoolers made laying out
the wire a simple task, and gas-powered re-winders made recovery and cleanup go fast.
A powered auger easily drilled through the 1 metre thick ice, allowing electrodes to be lowered into the lake-bottom mud, at each station.
The lake installation maintained perfect continuity in the true 3D field data set (uniform distribution, high density,
and multi-directional data set characteristics), as if the lake wasn't there.
Time, cost, risk?
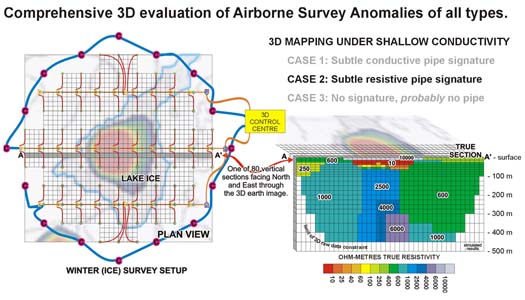
Northern Canada"Diamonds"
At right is an example of how 3D E-SCAN would wire a depression suspected of being the site of a buried kimberlite pipe.
In summer, the frozen surface would utilize a single floating centre to manage the pond-bottom electrodes.
Time, cost, risk?
back to top of this page
Island settings
IN PREPARATION
Examples of 3D E-SCAN approaches to salt-water island settings, including Unalaska Island, and proposed grid setups
for the southwest corner of Dominica, and a peninsula of Grenada.
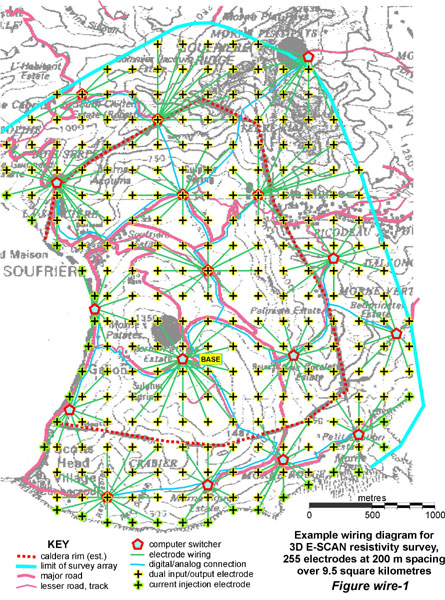
The proposed wiring for a geothermal 3D E-SCAN survey on Dominica covered a well-populated corner of the island.
The use of eighteen 16- and 25-electrode steel-boxed switching centers provides for simple, secure lockdown of critical
survey electronics against overnight tampering or theft, as opposed to deploying and protecting over 120 standard E-SCAN
3-electrode switching units.
This strategy leaves the management of unsecured wires (a tolerable risk) to be handled as well as possible through
interaction and incentives with local residents and community representatives.
Taking the extra time to place wires high in trees and bushes helps stop casual disruption, but plans must be made for
an expected substantial loss, and repeated replacement, of survey wire before the project is completed.
back to top of this page
Thick bush
In preparation
The single biggest advantage of running 3D E-SCAN in thick bush is that extensive line cutting is not necessary.
GPS positioning of grid stations is adequate. Access between stations need only be sufficient to walk though, laying wire,
rather than the straight line-of-sight cut lines that are needed if wires or cables are to be dragged back and forth.
Large trees need not be cut in order to maintain a straight line for cable-pulling, since cable-pulling is never required with 3D E-SCAN's flexible system layout.
back to top of this page
Cold weather
E-SCAN 3D survey equipment is designed and tested
for operation at -40 degrees (including batteries).
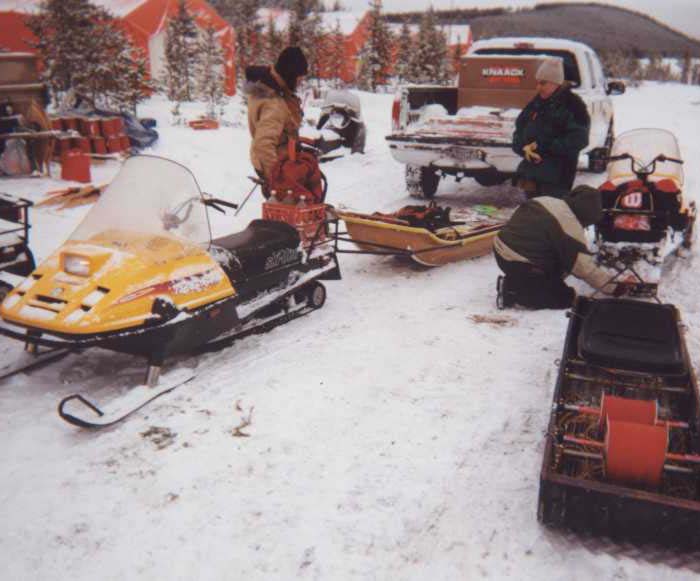
The E-SCAN crew prepares to lay grid wire on cut lines in dense bush, in the Athabasca Basin of Northern Saskatchewan (2001).
Seen in the distance, a small lake will require winter lake tools to maintain the uniformly spaced grid of survey electrodes across the entire survey area.
Projects that are mainly on land can be done in winter or summer. Where there are extensive open-water lake or swamp areas, the decision to operate in summer
or in winter will depend upon local conditions and client timing requirements. Both can be done cost-effectively by using the corresponding set of specialized
lake survey equipment. Northern lake projects may benefit from using the winter ice as an easily-traveled, stable platform for the
3D E-SCAN survey, using holes drilled in the ice to place lake-bottom electrodes. Where timing doesn't permit waiting for winter, or where a
lake will not freeze sufficiently to safely support work crews, different equipment gets the job done on the open water. See "... in any terrain - lakes" in
a tab further down the Home Page.
The target in the Athabasca Basin is deep unconformity uranium, here estimated at about 500 metres below surface.
Anomalies are conductive features in a resistive host, an ideal geophysical target setting whose interpretation here is routinely
compromised (for non-3D methods) by irregular, alternating conductive-resistive (swamp-esker) surface conditions.
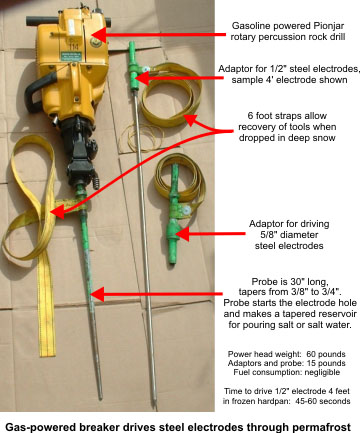
Special equipment: At -40 degrees, the ground can be frozen deep and hard, even below an insulating blanket of snow.
Above, a Pionjar "plugger" is adapted to drive the 1/2 inch and 5/8 inch (13, 16 mm) stainless steel electrodes into the hard ground.
All of the small tools have colorful tethers so that they remain easy to locate in the snow.
back to top of this page
Hot weather
Working in extreme heat means managing personnel hydration safely, while the E-SCAN system runs flawlessly.
The 100-fold signal advantage (vs dipole-dipole array) of E-SCAN means that 100 times less current is needed, so that electrode contacts
don't overheat or dry out during shooting. Conventional dry-terrain measures such as burying large surfaces of metal, soaked with gallons of
salt water, are never necessary.
See also "Desert, caliche", located in the tabs, to the left.
140° Fahrenheit Below, this eastern California E-SCAN 3D project (east of the Mesquite Mine and northwest of Yuma, Arizona)
encountered daily air temperatures approaching 140°F and metal surfaces too hot to touch.
Crew operations were limited to 2 AM to 9 AM, with the rest of each day spent in air-conditioned motel rooms.
The E-SCAN equipment functioned just fine. Project completion: on time, on budget.

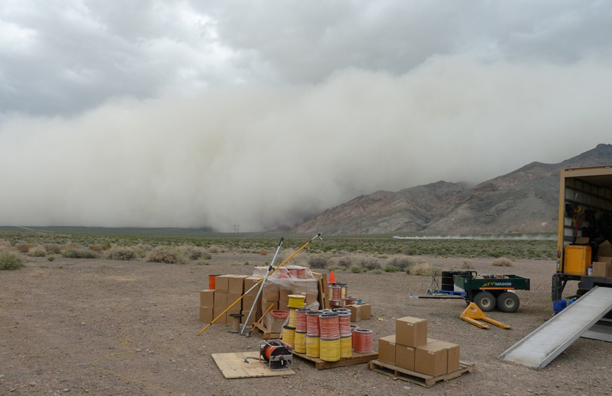
A dust storm has breached the Stillwater Range in north-central Nevada, and now descends upon the 3D E-SCAN base in Dixie Valley.
Two minutes after this photograph is taken, the work site is engulfed in dust.
Breathing masks for the crew, and high-quality filters on engine air intakes, can keep 3D E-SCAN survey progress going if storms like this one last more than a few minutes.
A rinse and recharge of equipment filters will add a half-hour to this day's shut-down procedures.
Wet weather
Working in wet weather with an extensive wiring system presents problems with leaks and unintentional grounding.
Advanced E-SCAN network diagnostics pinpoints insulation issues to permit rapid correction and repair.
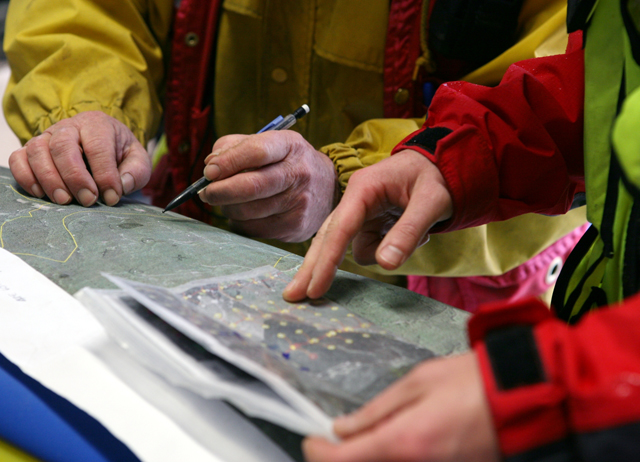
Winter in New Zealand's North Island is wet. While the E-SCAN instrumentation works fine, everything else has to adjust to the conditions.
Rain apparel, plastic laminated maps, special wire, and special control and system management software all come into play.
Damaged wire insulation that was undetectable (and irrelevant) in dry conditions suddenly becomes a significant issue, both for the signal level
wiring (most of the system), but especially for the few
current delivery wires.
Message to clients: Heavy or persistent rain will slow a survey down. If you have control over when you plan a survey,
assume that the least-rainy season will
usually be the most cost-effective time for running 3D E-SCAN.
For expected rainy conditions, it is worthwhile to start with new wire, free of nicks and insulation damage.
Then, select the appropriate wire for the wet conditions, for each aspect of layout and shooting,- this is mostly an issue of increased
insulation thickness for at-risk areas.
In uninhabited areas, wire issues are minimal, even in the rain. Wire can be hung on bushes, branches, laid on grass and mud, and it will remain intact and functional.
In an
intensely agricultural area like some of the New Zealand 3D E-SCAN survey areas, wire must be managed
around roads, lanes, cattle tracks, pens, and fields,- all of which entail opportunities for somebody or something damaging wire insulation
and creating leaks or grounding.
E-SCAN's system management software has the capability to test for breaks and unintended grounding throughout the system, working with crew
members in the field who will respond to operator requests to lift, cut or ground a wire in some specific location to help track down an issue
that is otherwise seen only as "this 400 metres", or "this wire segment from here to here". In the wet farm country surveys of New Zealand,
on the worst days we needed up to half a day to diagnose, repair and maintain the sometimes 50,000 metres of survey wire in use at any one time.
With a delayed mid-day start for the day's actual data collection, the 3D E-SCAN could still acquire most of a normal day's measurements
(several thousand) by pushing into the darkness before quitting. A well-motivated, appropriately-rewarded field crew can make a difference in keeping up production
when field conditions turn bad.
We can also work pro-actively to minimize rainy weather productivity losses. Knowing we may have repairs in the morning, some system
layout activities and post-survey clean-up activities can be scheduled to be done while repairs happen, accomplishing necessary work while
at the same time having crew available for system repairs as they are identified. Knowing we will be subject to rain means that we can set
up differently in the first place. Time can be taken to secure wire away from susceptible areas, such as raising it over driveway entrances or
over lanes where it won't be run over. Or using special heavy-insulation wire segments where ground traffic can't be avoided.
Installing checkpoints in long wire runs that are frequently accessed for
quick ohm-meter checks during
troubleshooting. These seemingly simple
preparations can really pay off in extended rain periods.
Time, cost, risk?
back to top of this page
MAPPING THROUGH INDUSTRIAL AND CULTURAL INSTALLATIONS
- open
pit
mines
- under
ground
mines
- near
electrical
blasting
- leach
pads,
ponds
- power
lines
- railways
roads
tracks
- agri-
culture
- pavement
townsites,
buildings
- grounded
fences,
pipelines
- small
property
areas
3D E-SCAN surveys operating through open pit (open cast) mines and quarries
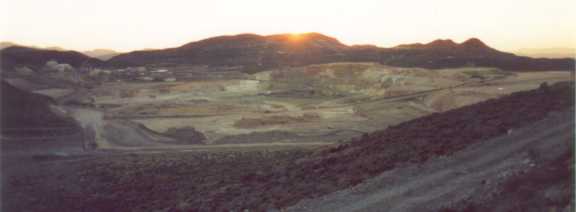
3D E-SCAN mapped through the Paradise Peak
open pit mine while it was in full daily-blasting operation, without delays or interference.
Other site-specific operational measures included:
- rubber mats and armored cables across heavily traveled routes to protect the E-SCAN wire.
- a key E-SCAN wire that accessed several electrode sites located within the open pit was buried in the main pit floor for protection
from the random movements of loaders and Haulpak trucks.
During the 4 days that E-SCAN survey setups were needed in the active mining area, delays and extra costs were virtually zero,
both for the mining operation, and for the geophysical program.

The Freedom Flats open pit mine was shut down and in a state of partial collapse when the E-SCAN crew safely wired it up for inclusion
in the high-density, multi-directional 3D E-SCAN field data set that was acquired over the surrounding area.
Apart from establishing a regionally-viable example ore signature, a lobe of potentially economic mineralization was mapped, extending west
under the surface waste dumps, and physically accessible from the pit floor.
3D E-SCAN surveys operating over active underground mining operations
Right, the large sweep of 3D E-SCAN at the lawyers property, Toodoggone District, British Columbia was operated directly over two areas of active underground mining operations.
Neither used electrically-controlled blasting, but precautions were still needed. The possibility existed for open exploration drill-holes to act
as gun-barrels should one become connected with an underground blast site. The E-SCAN field crew working on the surface above was pulled off to safety
every time an underground blast was scheduled.
There was no significant loss of time or productivity for either the E-SCAN crew or the underground mining team.
The E-SCAN crew usually carries extra radios for coordination in situations, like this, that may arise in the field.
The Giant Mine site presented so many surface hazards and operating obstacles that no conventional survey had ever been attempted.
A closer-than-usual survey grid spacing (300 feet) was employed to ensure that even after as much as 50% of the measured data were
dismissed (anticipating a worst-case data contamination scenario), there would be sufficient data for development of an objective,
subtly-imaged 3D earth model of the site. In the end, less than 20% of the data set was deemed as compromised, and deleted.
The strategy paid off, as was a virtually certainty from the outset, and a high quality 3D model was generated.
Following the plan, the field data set was then re-inverted using only 600 foot grid spacing data, confirming that the primary anomalies
could still be seen clearly and
unambiguously at this expanded spacing.
The 600 foot test proved that similar mineralization zones could be expected to be detected elsewhere along the trend, at a fraction of
the costs of the initial 300 foot grid survey.
A 3D E-SCAN survey was operated directly over an operating underground uranium mine in Saskatchewan, during a period when no underground
development blasting was planned. No specific precautions were therefore needed.
E-SCAN surveys operating over or near mining operations employing electrically-controlled blasting

The Giant Mine operated two 8-hour shifts per day, with four hours between shifts.
An electrically-controlled production blast generally occurred at the end of each 8-hour shift, leaving the between-shift 4-hour
period with no personnel underground, and no unexploded materials in place. For the period that the 3D E-SCAN crew was required to
survey over and near the underground mining location, extraordinary safety measures were employed:
- 3D E-SCAN operated only in the twice-daily four-hour intervals after each 8-hour underground
mining shift and blast cycle, so that no survey-related electricity would be presented in the mining area.
- During the mining and blasting periods, E-SCAN crew stayed off the property, to eliminate
any danger of blast-propelled (gun-barrel) projectiles reaching surface via unmapped open drill holes.
The Paradise Peak mine employed electrically-controlled production blasting, presenting a potential safety hazard
given the voltages and currents employed by the E-SCAN survey that ran through the open pit's working area. The image below shows a
typical daily sign-off sheet that certified the measures taken to disable the parts of the E-SCAN wiring system that lay in the mine
area, assuring that no stray electricity could interfere with the electrically-controlled blasting setup.
The E-SCAN field crew would report to the minesite lunchroom where they would remain until the post-blasting all-clear was sounded,
amounting to a two-hour daily delay for E-SCAN, and no delay for the mine operation.

Rubber/vinyl-lined leach pads, tailings ponds
The rubber or plastic liner used beneath some leach pads and tailings ponds is an electrical insulator which should not be breached.
Any current introduced above such a barrier will not flow into the ground.
Neither will potential field voltages arising from deeper current flow reach surface for measurement.
3D E-SCAN surveys treat such obstacles by placing an extra density of electrodes close to the edge of the insulated area, to secure
as many multi-directional measurements as possible, sampling beneath the insulating layer.
Usually, the loss will be one or two surface electrode positions, which will have a negligible effect on the local 3D imagery.
Power lines, high-tension corridors
3D E-SCAN surveys have been operated under and around power transmission systems such as the major 630,000 volt 60 Hz AC supply
for the aluminum smelter located at Kitimat, British Columbia.
Premier has also successfully operated DC resistivity surveys under and near 1,000,000 volt DC power transmission lines (Bonneville Power's "Pacific Intertie").
3D E-SCAN receiver circuitry can be set to reject either 50 Hz or 60 Hz noise in the most robust of ways,- by setting signal sample
integration timing for integer multiples of whole sine-wave cycles, thus eliminating either 50 Hz or 60 Hz signal components right
at the DVM integration level.
There appears to be no easy solution for the other instrumentation effects of measuring from wires laid (for long distances)
directly under and parallel to major AC transmission lines, so that practice is simply avoided.
With 3D E-SCAN's setup flexibility, there is always a way to lay lines to minimize the possibility of experiencing these substantial induced voltages.
Below, a high-voltage power line crosses 3D E-SCAN operations in New Zealand.

Below, a 1,000,000 volt DC transmission line in Nevada makes lots of audible hissing noise but presents no difficulty for
DC resistivity surveys that Premier Geophysics has operated beneath and nearby. This is the Pacific DC Intertie, the high-tech state-of-art
centerpiece of the Bonneville Power Administration's supply of northern-generated power to California markets.
FYI look at the length of the insulators that suspend the wires for your clue that this is no ordinary medium-voltage AC power line.

Railways, highways, roads, driveways, tracks.
The problems associated with the sometimes long-distance linear barriers caused by highways and roads are minimized with 3D E-SCAN technology,
since a single installed crossing can service a large survey sub-area on the other side, without incurring any extra delays or costs, and using
the about same amount of wire. Where a wire can not be suspended between trees to cross a road, a culvert or underpass of some sort must be found.
If nothing else works, an armored cable crossing can be anchored on each side of the road. In some areas, this will not be routinely permitted,
for example on some major interstate or state highways, though special permitting could be applied for.
The problem has never yet become insurmountable for 3D E-SCAN, with an answer always being found even if it requires a couple of kilometres of extra wire to accomplish.
Smaller roads and driveways in areas where there are no culverts or nearby trees are readily handled with anchored cables, with extra insulation
to prevent grounding. Standard field E-SCAN equipment
always includes dozens of armored road crossing cables, and spools of wire with
extra-thick high-density polyethylene insulation. Standard tools include an assortment of pulleys, lead fishing weights (for throwing),
slingshots, culvert-crawlers, floaters, fishing (casting) rods and reels, and assorted other devices to make road and obstacle crossings happen
very quickly, with minimum delay and maximum certainty of survey system durability. Where necessary, a potato gun was constructed and deployed.
Railways are easily crossed beneath the rails, between ties, except where a secured right-of-way may prevent approach (e.g. bullet train).
Below, a survey area is bisected by a major highway, and further complicated by a river. The highway issue is handled by two wire feed-throughs
that use galvanized steel under-road drainage culverts, allowing the two separate areas of the survey setup to function as a single uninterrupted 3
D survey area, as if the highway did not exist.
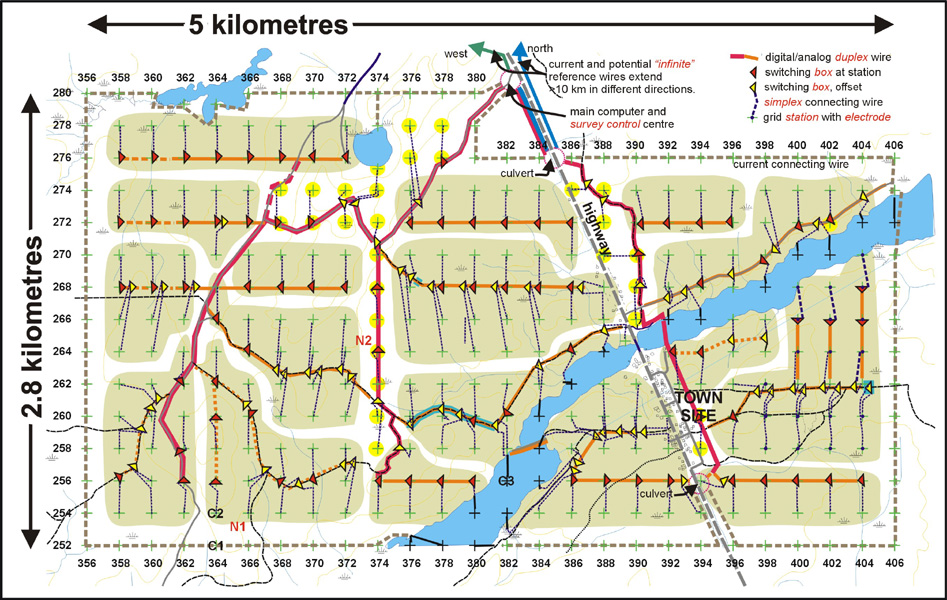

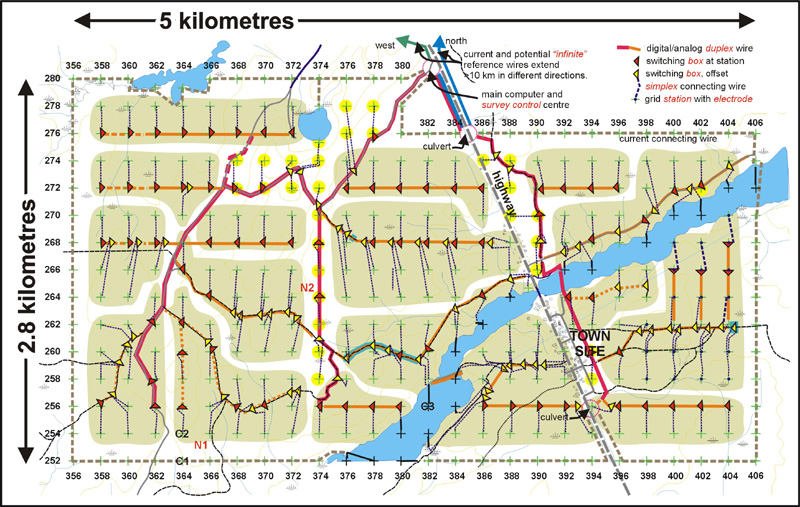
Right, one main road runs through this rural survey area in New Zealand, so available culverts were incorporated into the wiring plan to protect the wires.
Note the white dots on the operating map that indicate the available 1/4 station offsets (programmed into each crew GPS) that the crew may select as
alternate electrode positions. This would become necessary if a planned electrode position was in the middle of a paved road, or some other obstacle,
and needed to be placed in better conditions nearby. Having the coordinates in the GPS means that the crew person can proceed directly to the
alternative location, without wasting any time. Having the alternates on 1/4 (of nominal grid separation) increments means that the selected
alternate positions are still synchronized with the 3D earth model mesh, falling exactly (as required for processing) on a node between cells.
Also in this image, you can see an area of electrode spacings that is half that of the main grid.
The client had specific information about this sub-area (a geochemical anomaly) and requested the increased detailing in the 3D model in order to
map the sub-area in greater resolution.
Agriculture
Farm and ranch activities present multiple issues relating to animal interference, machinery movements, risk to people and livestock.
While some accommodation can often be made, it is not always possible to have a herd of cattle removed from a survey area, or other such preventative measure taken.
Often, the risk from livestock may not be known until something occurs, as is often the case when working in open rangeland, where cattle move
long distances in unpredictable patterns, both day and night. Sheep and other farmed/ranched animals also disrupt survey layouts, as do wild
animals such as rabbits, ground-squirrels, mustangs, and Aleutian whistle-pigs.
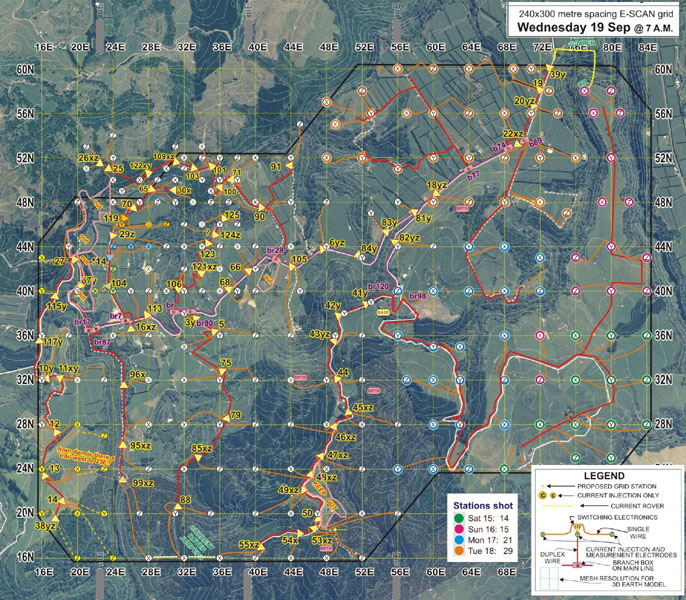
3D E-SCAN crews bring extra wire supplies, and plan for potentially major levels of daily repairs to the wiring system.
It is not unusual for livestock-caused losses from a single overnight period to exceed many miles of wire, sometimes requiring as much as a
half-day for replacement and repair. Special system management tools have been developed, and of course the powerful electronic diagnostics
built into the E-SCAN operating system helps to speed system diagnosis, repairs, and eventual confirmation of every part of a restored system.
Without these advanced tools and systems (and accumulated expertise), it would be easy for a survey layout to become simply unmanageable, with no data ever acquired.
At right, this area in New Zealand obviously involves agricultural activity (rectangular enclosures are kiwi fruit orchards) which is easily
managed with 3D E-SCAN's flexible layout options.
3D E-SCAN has operated in dozens of sites occupied by cattle, horses (sometimes wild mustangs), sheep, farmed and wild deer, farmed elk, and
a range of wild animals from rabbits and hares to the Aleutian whistle-pigs, to name just the domesticated and wild creatures that can and do
occasionally damage installed wiring systems. Some animals, like the
Aleutian fox, only want to help,
and cause comparatively little disruption in their
unbridled enthusiasm..
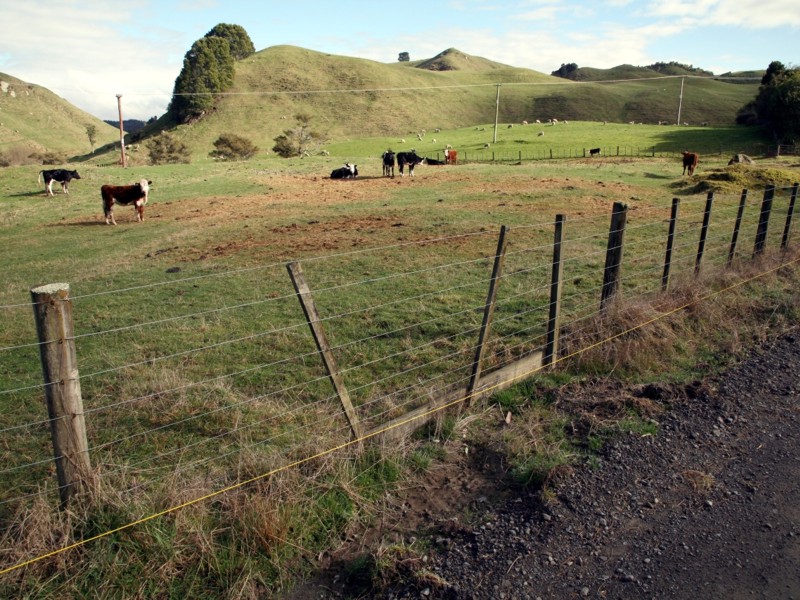
The area at left is so intensively farmed (sheep and dairy cattle) that specific farm-area strategies are budgeted and then employed to minimize delays to survey progress.
Occasionally, the project is gifted with a particularly sophisticated type of livestock. The last increment of 3D E-SCAN survey at Hollister,
Nevada encountered a herd of two-year-old
beef cattle which would individually go out of their way to find a spot where they could step over a wire without disrupting it.
In two weeks of field work involving over 100,000 metres of wire, only two wire breaks were experienced, versus an expected fifty or more.
These thoughtful cattle were rewarded by the appreciative E-SCAN crew when a concerted half-day effort was mounted (using a truck winch) to
rescue a cow which had fallen through the wooden deck covering an old concrete cistern, and was in danger of death by hypothermia from the icy water.
Said cow was seen (still avoiding wire) on subsequent days, obviously "no worse for wear".
(I like to think that an E-SCAN crew would have rescued any cow, regardless of wire-avoiding inclinations... G.S.)
Buildings, paved areas, townsites
Buildings present a physical barrier, but seldom occupy a significant surface area.
Wires and electrodes can be placed around buildings to shoot under, and maintain a reasonable density of injection and measurement points for
the multi-directional data. One expects most buildings to have grounded electrical systems, and some may be structurally grounded as well.
Electrode stations kept 5 to 10 metres away from any building seldom encounter problems. Where such problems occur, the loss of all data from
the problematic electrode position, or several of them, does not impact survey effectiveness or 3D image quality.
An asphalt paved surface has a similar insulating effect, but may offer other opportunities for securing electrode positions through its surface,
since waterproof integrity is not an issue. In a large parking area, for instance, an electrode can be installed through a mid-area planter or
even a crack or hole in the surface. Should those options not be available, the effect on 3D imaging remains negligible as long as there are not
more than 2 or 3
adjacent missing stations.
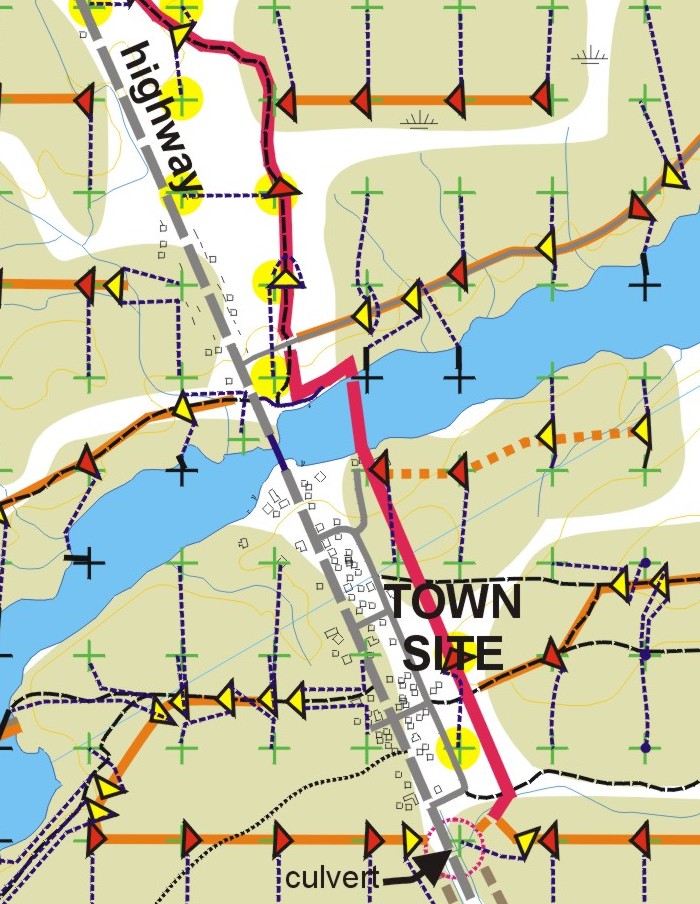
Townsites are managed as just another area of industrial clutter, with an added emphasis on protecting people, pets and personal property.
A small settlement can be surrounded by E-SCAN system wiring, with single electrodes pushed toward the centre along various routes.
All of the measurement system (the initial total E-SCAN wiring setup) is at safe voltage levels (less than 1 volt), so the risk is primarily one
of disruption of survey progress by disturbance of safe-level, unattended wiring. When current injection becomes involved, a single current rover
wire can be escorted to its several in-town setups in a single day, with whatever along-the-wire guards may be needed to protect the public for that brief period.
Any survey that anticipated involving a substantial town of hundreds of residences and many streets (example: the town surrounding the Waihi
Mine in New Zealand), arrangements might be made to use existing utility poles for stringing measurement wires out of reach, while current
injection could still be managed via a single guarded circuit along the street. 3D E-SCAN's two-orders advantage in signal strength means that
the survey might be conducted with no more voltage than is already present in the local distribution system,- 120 or 240 volts,- coupled with
extra signal stacking at the receiver end.
Working in areas of less dense habitation requires contact with land owners, and signage on wiring.
A few extra precautions signal to the locals a good-faith effort at safety, which to date has resulted in not a single injury to the public,
and not a single denial of "permission to proceed" from land owners or from local councils.
Buried pipelines, grounded fences
Field crew avoid placing electrode stations within 10 metres of any visible source of distortion. Buried pipes may not be visible.
The effects from proximity to a grounded system will show up in the 3D E-SCAN field data, where they can be evaluated and if necessary, culled.
Loss of all data from occasional sites is expected. In a typical survey, several dozen site data subsets may be scrapped for various reasons,
while not affecting survey outcome or 3D model integrity.
Small property areas
Often the survey working area is laterally constrained, limited either
legally by claim boundaries or no-permission land areas, or
physically by terrain conditions,- rivers, cliffs etc.
While physical impediments can be cost-effectively overcome by 3D E-SCAN's uniquely flexible operating layouts, legal or boundary constraints may prevent all technologies from placing measurement array components past a given boundary.
When you find yourself limited to a specific, rather limited area of ground, the ability of a resistivity/IP system to actually acquire deep enough data becomes a serious question. Any survey technique that requires a dipole measurement setup (like ORION 3D or even TITAN 24) is at a disadvantage compared to 3D E-SCAN, because the depth of investigation for dipole arrays is a fraction of that of E-SCAN's fundamental pole-pole array, for comparable areas of lateral survey array setup.
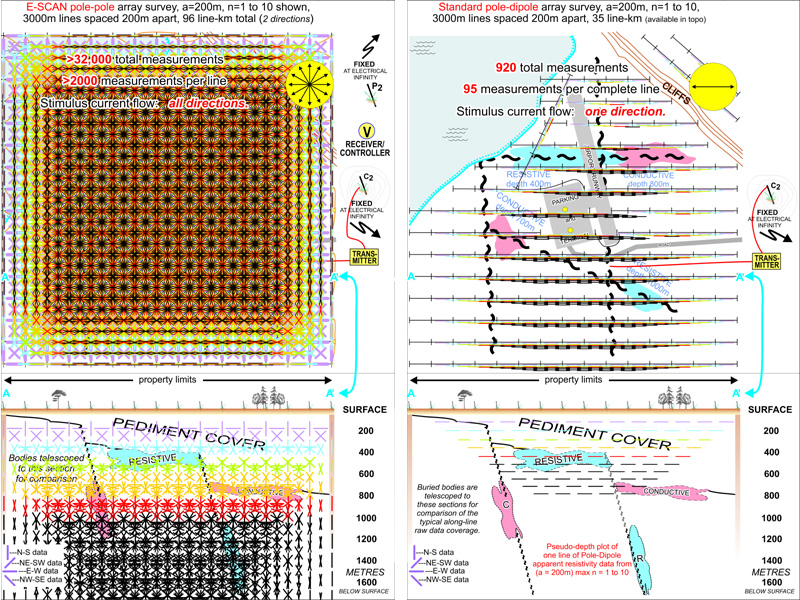
Consider the image below, comparing depth of investigation for E-SCAN's fundamental pole-pole data type at left with the derivative data of a pole-dipole array at right. Pole dipole (right) is the standard field setup for both TITAN-24 and ORION 3D surveys,- pole pole is not an option. For Orion 3D, the plan view will include all directions, but the distance from the edge, and the maximum depth, will remain the same as indicated in the lower (section view) plot.
The depth of investigation is clearly much greater for E-SCAN's fundamental pole-pole array, at left. And when the survey's boundary is approached, you can see that pole-pole (at left) samples much closer to the edge (and deeper) than the pole-dipole array used by competitive methods ORION 3D and TITAN 24. In
firm-boundary small properties, you may need E-SCAN's fundamental pole-pole data to effectively test to the depths you need. Perhaps unexpectedly, E-SCAN's significantly greater depth and closer sampling proximity to property boundaries is available from E-SCAN at a fraction of the cost of the under-performing ORION 3D survey. Compare quotes.
See also the "DEPTH OF INVESTIGATION" tab below on this page.

INTRODUCTION AND INDUSTRY CONTEXT
The following summarizes the technical performance issues that this website tries to communicate:
Positioning within the industry:
Ground-operated exploration and engineering geophysics consists of four main disciplines:
(1) Seismic methods
(2) Electrical methods
(3) Magnetic methods
(4) Gravity methods
Seismics dominates annual expenditures for geophysics as the dominant method for hydrocarbon exploration, where gravity, magnetics and
electrical play comparatively minor roles.
For other resources such as metals, industrial minerals, groundwater, geothermal energy, the electrical methods dominate, supported by magnetics and
gravity. Seismic plays an occasional but increasingly frequent role.
The focus of this website is on the largest of the non-seismic geophysical
sectors: the ground-operated electrical methods.
Ground-operated electrical geophysics consists of two main groups:
(1) the DC methods (where E-SCAN resides), all of them
controlled-source, and
(2) the Electromagnetic (EM) methods, including natural-source and controlled-source approaches.
Both the DC and EM groups historically have exhibited particular difficulty in detecting and resolving anomalies in the resistive half of the
conductive-resistive spectrum. While generally successful with conductive anomalies, both groups could benefit from more positive geometric
definition and 3D positioning of buried conductive features.
Partly explaining the above detection difficulties, both the DC and EM groups produce only a relatively sparse field data set which, while
sufficient for resolving simple conductive anomaly settings, allows a high degree of ambiguity (multiple
valid model possibilities)
in the presentation of drill targets in more complex geo-electric conditions, even when the target anomaly is of the favored
conductive type.
In encountering rough terrain, both the DC and EM group methods become increasingly difficult and expensive to physically lay out and operate,
all eventually succumbing to physical impossibility or untenable costs as terrain extremes worsen. Sparse data issues, already significant in
easy terrain, may become exacerbated with the denial of access to adjacent lines of data with which to support anomaly interpretations.
In encountering cultural and natural sources of data distortion, sparse-data methods have nothing to spare... those data that are compromised by
these sources either go undetected (to the detriment of the interpreted result) or are removed and leave a gap in the already-sparse data coverage.
In the evolution of remote-sensing technologies, it is often the case that limitations of existing technologies are not apparent until improved
techniques appear with the capability to assess and explain such limitations. Consider the advent of the X-ray CAT-scan and its illumination of
the limitations of conventional X-ray technologies. We respectfully suggest that 3D E-SCAN is a development of that magnitude in the area of geo-electric imaging.
This website is dedicated to explaining and illustrating the ways in which 3D E-SCAN has identified limitations in the conventional electrical survey methods,
and then provided a hard-data-based resolution for precisely those limiting issues. Where issues appear insufficiently resolved (or just plain unbelievable)
to you, please let Greg know of your concerns via e-mail.
The advances of 3D E-SCAN occur in the DC resistivity group of electrical methods, though the issues, challenges and newly-realized benefits affect
exploration undertaken within both the DC resistivity and the EM groups. Reference will be made on occasion to the closest EM relative to DC resistivity,
the CSAMT method. Otherwise, this is a DC resistivity story, since, to date, no such
equivalent development
has taken place in the EM group of methods.
BACKGROUND: The DC resistivity survey electrode arrays.

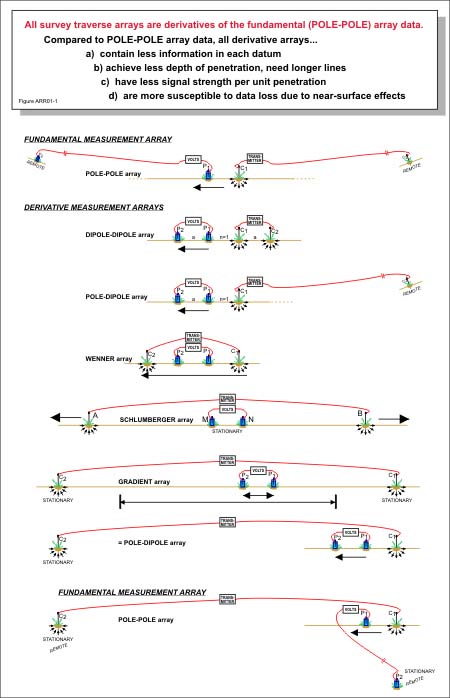
All DC resistivity surveys employ four electrodes, two for current injection, and two for measurement of surface potential differences (voltages).
In all of the commonly-used exploration surveys, the electrodes that are in the active survey area are positioned in a line (collinear).
The current electrodes are usually labeled C1 and C2. The potential (measurement) electrodes are labeled P1 and P2.
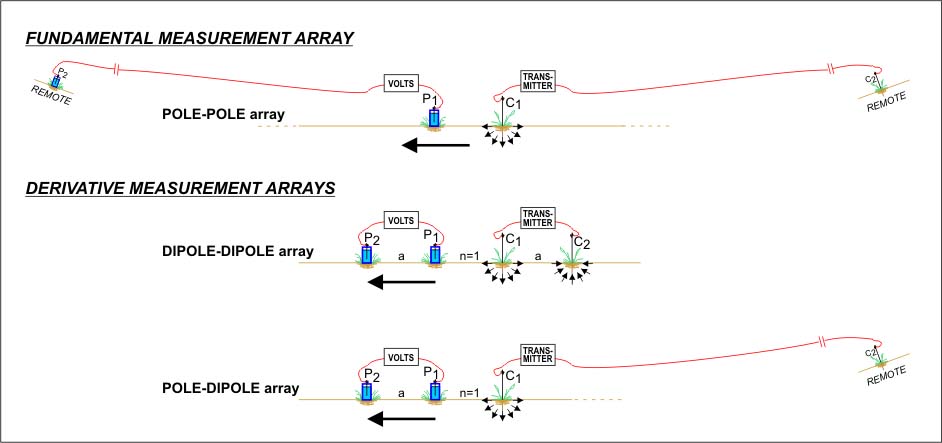
Above is an illustration of the four arrays that are discussed here. In two of the arrays, pole-dipole and pole-pole, one or two of the electrodes (known as "infinite" electrodes) are positioned distant from the active survey area, where their effect on the survey is nil (in theory) or insignificant (in practice). Of these four arrays, dipole-dipole and pole-dipole make up more than 90% of all DC resistivity (and IP) surveys done today.
The Wenner array, an early-years favorite, is almost never used now. Pole-pole is the array employed by E-SCAN, but has yet to be offered widely for commercial use.
The top array is pole-pole, the simplest with just C1 and P1 active in the survey-area measurements. Increasing the distance between C 1 and P1 increases the effective penetration of the measurement.
Moving the P2 potential infinite in close to P1 provides the pole-dipole array. Increasing the distance between the C1 and the P1-P2 dipole increases the effective penetration of the measurement.
Bringing in the C2 infinite makes the dipole-dipole array. Just two short wires - easy to work with. Increasing the distance between the two dipole increases the effective penetration of the measurement.
Flip the C2 electrode to the other side of the measurement P1-P2 dipole, and a Wenner array is established.
Maintaining equal spacings, expanding the whole array increases the effective penetration of the measurement.
Pole-pole is a fundamental measurement, i.e. a measurement of the absolute voltage at a point distant from the current injection electrode, measuring a simple electric field caused by current flowing without the distortion that would be caused by another nearby current electrode.
This delivers both the highest possible signal voltage and the greatest effective penetration of any array.
All other arrays measure local voltage
gradients, which are the effective derivatives of the individual absolute-voltage pole-pole measurements that could be made if the electrode pairs were accessed separately (as in 3D E-SCAN), instead of paired as dipoles.
The effect of measuring a derivative (as opposed to an absolute voltage) is the loss of considerable signal, including much of the deeper information content.
The figure above left includes the gradient array and the Schlumberger (sounding) array. The gradient array maps a single area-wide potential field to reveal considerable detail of lateral resistivity variations, while providing no information as to the depth to any of the features that may be imaged.
The Schlumberger array is used in soundings to resolve one-dimensional (layered) earth settings, often in search of aquifers.
CONVENTIONAL DC RESISTIVITY SURVEY
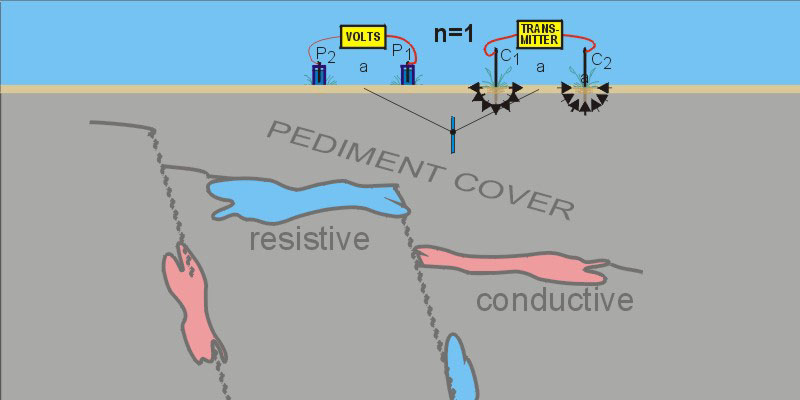
At right is the historically most-applied DC resistivity (and IP) survey array, the dipole-dipole array, shown in a n = 1 configuration.
With pole-dipole ranking a distant second as a deeper-search method, dipole-dipole remains the most-used array to this day, with good
reasons including low-cost rapid field production and an abundance of software packages for data inversion and display.
A limited effective depth range is the main drawback, which is where the more complicated and costly pole-dipole array may be brought into play for deeper targets.
The dipole-dipole interpretation software is generally applicable to pole-dipole data as well.
IMPORTANT NOTE: Unlike conventional pseudosection plotting conventions, this website uses a modified
pseudosection
(Edwards, L.S., 1977) in which the plotted position below the line represents the
actual effective penetration of the array in an undisturbed,
uniform earth setting.
This plotting innovation allows direct comparison between the effective penetration (Ze) characteristics of different arrays, an
aspect that is particularly useful for our many-arrays discussion. The bar represents the layer from which approximately 50% of the
surface-measured signal originates, with the plot point being the median value of that zone.
In operating a dipole-dipole survey, the initial setup provides for current to be injected into the ground at one electrode, and withdrawn
from the other to complete the circuit. The flow of electric current through the ground sets up an electric field perpendicular to current flow,
that field reaching the surface outward from the current electrode(s). At some distance from the current electrode, the measurable voltage at surface
will substantially reflect what is happening in the earth at a depth roughly proportional to the distance from the current injection site.
The greater that distance, the deeper the measurement. At n = 1, the effective penetration (Ze) point is calculated to be 0.416 of the individual
dipole length... if this survey employs 100 metre dipoles, the n = 1 separation measurement Ze is 41.6 metres below surface (in a uniform earth,-
less in variable more-conductive conditions, and rarely more than stated).
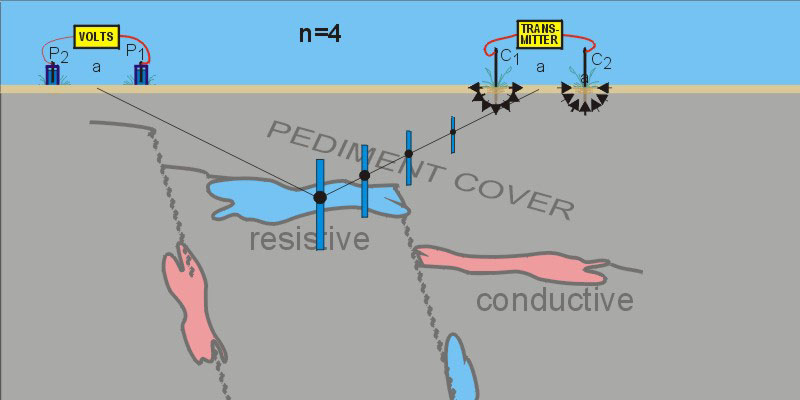

At right, the measurement dipole P1-P2 has been expanded out to four dipole-lengths distance (n = 4) from the current dipole.
The measurement is plotted as the n = 4 Ze of 1.22 x 100m = 122 metres below surface (n=4 factor is 1.22 times dipole length).
The survey might stop at n = 4, but often continues to n = 7, and sometimes to n = 10 if signal levels allow, and if such
depths warrant the cost of continuing to move the P1-P2 dipole ahead to greater "n" separations, for every current dipole setup, to gather the deeper data.
When the intended maximum "n" separation datum has been acquired, the current dipole C1-C2 is moved one dipole-length along the line,
and reinstalled ready for another expanding measurement sequence. Repetition of this measurement cycle at each station along the line
results in the accumulation of a continuous line of measured data, all aligned in the direction of the line and array layout, and sampling
at the increasing (n = 1-4 or n = 1-7) nominal (Ze) depths.
While some inferences can be made by viewing these plotted raw data, these are never obvious and considerable skill and experience is required.
The data are often processed by computer inversion in an attempt to generate a true vertical section
of the earth's geo-electric characteristics. All four DC resistivity surveys discussed here repeat this process of data acquisition, moving to
adjacent lines to acquire additional lines of data until the entire project area has been sampled.
Here's a question: If we have installed and wired four electrodes at grid stations along a survey line, for example dipole-dipole array at n = 4,
we can measure one resistivity value. Then the electrodes have to be moved. How might we get more information from these four electrode positions?
Here's the answer: Within the four electrodes, there is only one dipole-dipole array measurement to be had. But if we abandon the convenience
of using a current dipole and instead deliver current individually to each of the two electrodes that we just used for the dipole-dipole measurement,
we could have two separate pole-dipole measurements from the same four electrodes.
These will sample deeper, and perhaps surprisingly, have a stronger signal even at the increased depths.
If we abandon the convenience of using a measurement dipole and instead measure the actual voltage at each of the two electrodes that we
just used for the three dipole-dipole and pole-dipole array measurements, we could have four separate pole-pole measurements from the same
four installed electrode sites. These will sample even deeper, and have an even stronger signal strength than the shallower measurements.
The answer in action: 3D E-SCAN does exactly this, not just along the lines, but with combinations of electrodes all over the property grid.
The resulting data set is still "conventional resistivity", but the characteristics of this measured data set open up new possibilities for
computerized interpretation, in much the same way that the X-ray CAT-scan's immense observed data set supplies the basis for the objective,
highly-resolved 3D imagery that we rely on for medical diagnostics. 3D E-SCAN is still classic DC resistivity, with the same fundamental
measurements, now taken to a new level through intelligently-designed measurement automation, feeding true 3D raw field data to corresponding 3D earth image processing.
Other sections on this site elaborate.
DEPTH of INVESTIGATION
Compare these effective penetration numbers, for data from a survey array laid out, on surface, over a distance of 600 metres:
Dipole-dipole array: (a=100m n=4) 122 metres
Pole-dipole array: (a=100m n=5) 209 metres
Pole-pole array: (a=100m n=6) 516 metres
Pole-pole array data provide clearly superior penetration, but achieving useful depth (and lateral range) of investigation is a complex, many-faceted issue.
The shallowest performer of the three (dipole-dipole) is also the fastest, simplest, lowest cost survey. Pole-dipole is the industry workhorse for deep
IP and resistivity, substantially more complex in operation, slower and more expensive. Pole-pole arrays, despite superior depth performance, are
almost never used due to a combination of real and perceived operating issues, setup and data gathering complexities, maintenance of long wires, slow
progress, high costs, and (the perceived notion...) propensity for inductive signal interference.
3D E-SCAN technology addresses all of the limitations attached to conventional pole-pole array operations to secure the performance advantages in a form
that leapfrogs pole-pole from last place to first in terms of array operating cost-effectiveness and hands-on field practicality.
This multi-level technological breakthrough improves on each of the three main limitations that prevent most conventional DC resistivity survey arrays
from effectively mapping deeper into the earth:
1. Loss of signal strength occurs at deeper levels.
2. The space required for surface array layout becomes unmanageable for greater depths.
3. Reduced resolution (due to sparse deeper data) limits deep target recognition.
This page compares the currently best-performing (pole-dipole array) and the historically most-used (dipole-dipole array) conventional
DC resistivity surveys with the basic measurement array unit of 3D E-SCAN, the pole-pole array, to explain the simple physics behind the advantage that pole-pole brings.
The companion operating efficiencies are explained elsewhere.
Right, top: The three survey arrays are diagrammed. All arrays employ four electrodes. The pole-dipole array employs a stationary remote "infinite" electrode, using three electrodes positioned on the line, and moved, for each measurement. Pole-pole employs a second remote electrode, leaving just two electrodes for each measurement. These are small differences, with large impacts.
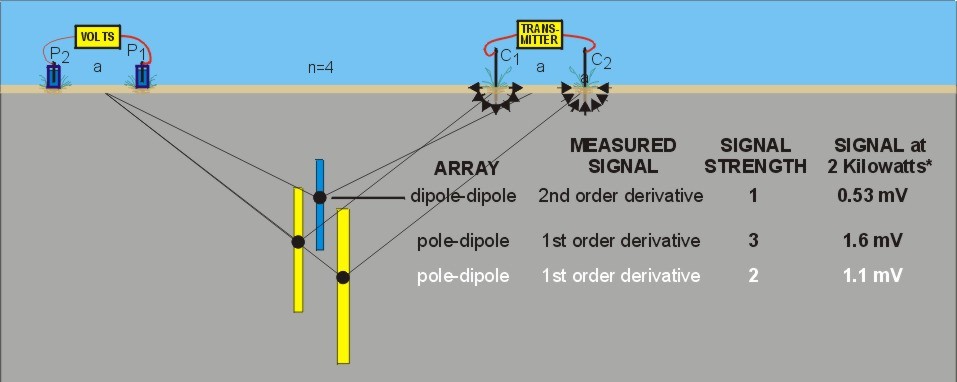
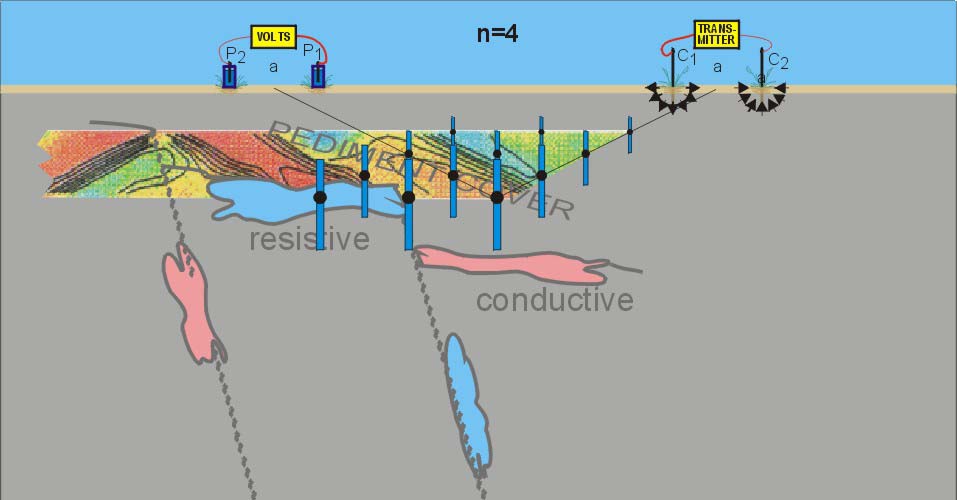
Image 2 (from top): shows part of a line of dipole-dipole array measurements, where sequences of four increasingly-deep measurements have been made from three current dipole setups along the survey line. This comparison and discussion is based on the four electrodes used for a single dipole-dipole survey array measurement at n=4 (the deepest of those shown here).
Image 3: One of the n=4 measurements is shown here, with four dipole separations (n=4) distance between the current and potential dipoles, from a typical
range of separations of n=1 to n=7. The measurement is plotted at the effective penetration ("Ze" of
Edwards, 1977) depth for that array geometry. Using an effective depth (Ze) value, computed for each array and spacing, allows direct comparison between different array data on the same plot. Remember, we are concerned about three factors that will control the actual availability of each Ze-plotted datum: signal strength must remain high enough to allow measurement, array layout space requirements along surface must remain reasonably compact to fit in the available space, and the effectiveness of the datum in contributing to deep target resolution is obviously important.
Image 4: Here is a pole-dipole array measurement, made using
three of the four electrodes.
The measurement's effective depth is greater, signal level is greater, and the total length of the surface setup is smaller.
These are improvements in all three important criteria.
Image 5:A second pole-dipole array measurement uses the other current electrode location to generate a second, completely different earth measurement.
This measurement's effective depth is greater still, signal level is greater, and the total length of the surface setup is still within that used by the dipole-dipole setup.
Instead of a single dipole-dipole measurement, we have two different samples of the same ground, with deeper information, and at higher signal levels.
This is the essence of why explorers who need to go deeper, or who face signal adequacy difficulties due to local conditions, will opt for a pole-dipole array survey over the (usually) lower-cost dipole-dipole array option.
Image 6: Having established a second distant, permanent "infinite" electrode, this one for measurements, the pole-pole or "two-electrode" array can now make use of the four electrode sites in even more advantageous ways. Using the two centre electrodes, a pole-pole measurement that takes up only 2/3 of the surface layout distance of the original dipole-dipole array measurement delivers 2.5 times the effective penetration (Ze), at 15 times the signal strength.
This may be your first indication of just how much information is lost when the fundamental field measurements are subtracted from each other in the dipole survey arrays, and how much is retained when
cost-effective pole-pole measurement capability is enabled.
Image 7: Among the four electrodes, there are four unique combinations of current and potential electrodes.. here, another selected pair is spaced a little wider, providing deeper information, still at a very high signal level.
Image 8: Another pairing delivers a third unique pole-pole array measurement.
Image 9: All four pole-pole array measurements are now shown. Each pole-dipole measurement is a derivative of two of the pole-pole data.
The second-order dipole-dipole measurement derives the two pole-dipole data, or from all four pole-pole data. By making the effort to establish two remote reference electrodes, thus enabling two-electrode (pole-pole) array measurements, the depth and information content of these four fundamental data is accessed from just four electrodes. The four pole-pole array data contain all of the information of content of the dipole-dipole datum and the two pole-dipole data, so there is no disadvantage in measuring just the four pole-pole data.
As a further bonus,- the pole-pole
fundamental data are absolute voltages that represent the primary numerical values used as input (and output) by 3D model inversion processing. Derivative data (as differences or gradients) are useful to the inversion process only after each interim inversion model's voltages are computed as equivalent array derivatives, for comparison to the field data.
This diminishes the actual information being compared at each step of the inversion's iterative process, making the inversion less effective in forcing an objective, unique-as-possible earth model solution (quite apart from the disadvantage of the derivative data being so sparse in number).
Last image: The pole-dipole array data from a complete field survey are compared to the data set from a 3D E-SCAN-enabled pole-pole array survey.
One data set qualifies for true 3D objective earth modeling with anomaly detection across the entire conductive-resistive spectrum.
The other data set represents a probable failure to detect all four of the target features, three being too deep, and the shallower body being resistive - likely to remain undetectable by uni-directional sparse data,
at any depth.
For further details, review this slide show:

What's popular? In general, if a target can be reached by dipole-dipole array survey, that method is usually employed, being comparatively cheap and fast as long as the transmitter current source can be backpacked along the lines.
For deeper targets, or where backpacking is not practical, a pole-dipole array survey delivers significant advantages in both effective penetration and signal strength.
Pole-dipole's requirement for a stationary transmitter means high-power equipment can be used, further boosting signal and depth performance.
Any survey requiring a transmitter of greater than 2000 watts power is usually undertaken as a pole-dipole survey, since the transmitter can not be moved along the lines. Outside of E-SCAN's automated application, the pole-pole array is almost never used in modern resource exploration.
QUICK SUMMARY: DC resistivity array usage.
- Dipole-dipole is the easiest, fastest, and lowest cost survey method, but produces the least penetration, delivers the poorest signal strength, takes up the most surface real estate per unit penetration, and suffers the greatest loss of data from sources of near-surface distortion. Very little wire in the field.
- Pole-pole is the most complicated, slowest, and most expensive survey method, but produces the greatest penetration,
delivers the highest signal strength, takes up the least surface real estate per unit penetration and suffers the least loss of data from sources of near-surface distortion. Most wiring in the field.
- Pole-dipole array performance lies in the middle, in every category. Significant wiring in the field.
CRITICAL ISSUE: LATERAL INVESTIGATION: we're never just looking down...
This section will present perhaps the most important technical information for people having access to, or relying upon, collinear electrode array results for exploration decisions. Large amounts of this type of survey data were collected for geothermal exploration (by the University of Utah Research Institute, among others) and for metals exploration by a wide range of corporate and government entities.
Fundamentally misplaced reliance upon the results of single lines (or widely spaced lines of data) will have left many prospective areas misunderstood, with many of them effectively unexplored if such results were relied upon as a valid assessment of site possibilities.
In the meantime, the essence of the problem (and its solution) is also reviewed in coverage of the Mt. Cayley 3D E-SCAN survey conducted for the Geological Survey of Canada, and reported on this website in GEOTHERMAL.
Any DC resistivity measurement not only measures the effects of what is directly below, but also the effects of anything within that depth's
radial distance to either or both sides of the line,including below. A single line of data with an anomaly showing at an effective "depth" of 600 metres could be a response to some feature located 600m to one side of the line, at shallow depth, with nothing anomalous below the line.
Drilling this "deep" anomaly will miss the true anomalous location, yet the explorer may be led to believe that a competent cycle of geophysical target mapping, followed by drilling, has been undertaken and completed. The negative outcome will usually be accepted... "not every anomaly or prospect delivers a resource."
The magnitude of the problem is potentially extremely large. The opportunity is equally large. Properties dropped on the basis of inadequate exploration such as this remain just as prospective as they were when the cycle of geophysics-then-drilling was undertaken.
A review of past DC resistivity (and IP) exploration practices (and the conclusions drawn therefrom) can be expected to deliver many properties for fresh re-examination, on the basis of a high probability of ineffective prior exploration.
This is an opportunity similar to that provided by the only-recently-proven ineffectiveness of conventional survey methods in detecting resistive targets (includes most of the world's
volcanic-hosted epithermal gold orebodies) not just at depth but virtually at surface.
These properties remain actually unexplored, while previous property managers remain convinced that they
conducted valid exploration, and that the results legitimately showed nothing there.
In fact, most volcanic-hosted epithermal gold properties remain under-explored principally because resistive anomalies don't show up in conventional survey results, regardless of how inappropriately such data may be plotted or interpreted.
Shore (and Clearwater?) published a couple of papers related to this topic in 1992, which are cited in the References and Citations section below.
Two illustrations from the paper on LINEAR E-SCAN are shown above (mouseover to flip images). The images illustrate a far-offline source of anomaly response as a positive attribute, enabling low-cost single-line conductive-target-only reconnaissance
mapping sweeps,
positive as long as the dynamic is understood and there is provision for evaluating every anomaly to resolve exactly what location(s) is that is responsible for the anomaly.
Correspondingly, the images show that whether the anomaly is seen in dipole-dipole or pole-pole array results, not understanding that the cause
may not be "below the survey line" can result in drilling straight down, finding nothing, and perhaps abandoning the property.
This section remains incomplete. These papers are included in REFERENCES:
LINEAR E-SCAN... -

Hidden anomalies... -

SIGNAL LEVELS and INFORMATION CONTENT not started
See coverage of signal levels elsewhere.
OPERATIONAL - SUMMARY OF SPEED ADVANTAGES not started
OPERATIONAL - SUMMARY OF COST ADVANTAGES not started
3D EARTH MODEL: DATA OUTPUT FORMATS; IMPORT RESULTS INTO USER'S GIS, MAPPING SYSTEMS not started
- 3D Viewer:
Introduction
and use
- 3D model file
ASCII files
for GIS use
3D Viewer: Introduction and use
Outputting ASCII model files for GIS uptake
References and citations, links to other sources, sites in progress
Accumulating citations here temporarily. IN PROGRESS - to be formatted later
 Shore, Greg A. and Clearwater, R. Peter, 1992a.
 LINEAR E-SCAN: A reconnaissance resistivity mapping system that evaluates its own anomalies en route:
Geothermal Resources Council TRANSACTIONS, Vol 16, October 1992, p 263-272.
Shore's notes: This paper introduces the concept of reporting single-line traverse anomalies within a 3D
effective survey search area,
as opposed to positioning at a nominal depth below the survey line.
The concept recognizes that the anomaly could originate from materials located anywhere within a radial distance from the line, or from multiple locations
acting to present a single measured anomaly value. By graphically acknowledging the uncertainty, this presentation method reserves the issue of positioning
any such source location(s) until necessary further resolution (requiring more data) is acquired. Implicit in the paper's thrust is the fact that there can
be no single interpretation for deep (or distant) single-line anomaly expressions, meaning that where such unilateral interpretations have been offered and
acted upon, a negative exploration result may be null and void; the host property retains its unexplored status.
The paper is an endorsement of the virtually universal need for data-intensive true 3D data collection and subsequent objective 3D inversion
modeling, or at least its linear equivalent, multiple cross-line traverses. This mode of data plotting was used exclusively for reporting of DC resistivity
survey results for geothermal exploration in western Canada during the active period of 1975 to 1984. An improved copy of this paper with clearer full-color
graphics is planned for inclusion here in the references section of the Premier website, sometime during 2011.
 Shore, Greg A. and Clearwater, R. Peter, 1992b.
 Hidden anomalies: Small near-surface resistivity variations can completely mask larger, deeper anomalies:
Geothermal Resources Council TRANSACTIONS, Vol 16, October 1992, p 255-261.
Shore's notes: This paper reviews the previously understated limitations of deep (or laterally-distant) data in the vicinity of near-surface
(near-electrode) variations, particularly in the case of single-line traverse data, but also in full grid surveys that fall short of qualification for true 3D inversion.
As with Shore and Clearwater (1992a), this paper advises that areas whose definitive geophysics display the described signatures can not be effectively evaluated
except to observe that some shallow (near-electrode) variation exists and deeper information is lost in the resulting distorted patterns.
The survey data must be considered inconclusive.
The paper is an endorsement of the virtually universal need for data-intensive true 3D data collection and subsequent objective 3D inversion modeling.
An updated copy of this paper with clearer full-color graphics is planned for inclusion here in the references section of the Premier website, sometime during 2011.
Bibby, H. M. and Risk, G. F., 1973. INTERPRETATION OF DIPOLE-DIPOLE RESISTIVITY SURVEYS USING A HEMISPHEROIDAL MODEL: Geophysics 38, pages 719 - 736
Abstract: The solutions for the potential due to a current source near a hemispheroidal body of finite resistivity,
which have been given by Cook and Van Nostrand, are adapted for use with dipole-dipole resistivity arrays.
In the limiting case where the current dipole is at a large distance from the hemispheroid a simple expression is obtained for the apparent resistivity
measured at the center of the hemispheroid.
For an arbitrary placement of current electrodes, apparent resistivities are obtained by summing a double series involving the associated Legendre functions.
Theoretical results using differently shaped hemispheroids are compared with field data obtained from several dipole-dipole resistivity surveys of the hot
water reservoir of the Broadlands Geothermal Field, New Zealand. The comparison enables an estimate to be made of the depth of the geothermal reservoir.
Edwards, L.S. 1977. A MODIFIED PSEUDOSECTION FOR RESISTIVITY AND IP: Geophysics 42, 1020 (1977)
Abstract: L. S. Edwards, U.N. Development Program, Rangoon, Burma
"Dipole-dipole induced-polarization measurements are commonly presented as pseudosections, but results using different dipole lengths cannot
be combined into a single pseudosection. By considering the theoretical results for simple earth models, a unique set of relative depth
coefficients is empirically derived, such that measurements with different array parameters will "mesh" smoothly into a combined pseudosection.
Application of these coefficients to a number of theoretical and field cases shows that they give reasonable results when applied to more complicated models.
The empirical coefficients are compared with Roy's theory of "depth of investigation characteristic," and support that theory, if a
modified definition of "effective depth" is accepted. This leads to an absolute depth scale for the modified pseudosection.
It is shown that rough estimates of the depth to the top of an anomalous body can be made directly on the pseudosection, at true vertical scale.
This definition of effective depth is applied to other electrode arrays.
It is shown, by examples, that the resulting pseudosections give consistent estimates of depth to top, within the characteristic anomaly patterns of each array.
The effective depths for various arrays are compared; the results agree with the traditional applications of each array.
Shore's note: This is probably one of the most useful published papers I have ever come across.
While Ze is not involved in 3D E-SCAN's process of data acquisition and subsequent 3D inversion processing of data,
the concept of Ze is critical to the explanation of how surveys work, where signal content comes from,
and why we need what we need to meet the requirements for an objective, robust 3D earth geo-electric model.
Roy, A. and Apparao, A., 1971. Depth of investigation in direct current methods: Geophysics, v. 36, p 943-959.
Shore's notes: The paper shows the calculations for the Depth of Investigation Characteristic (DIC) of some common collinear arrays.
One of several papers behind Edwards' (1977) work in expanding the DIC concept for same-section comparison of effective
depth ("Ze" of Edwards) between different arrays. Ze and DIC are similar,- Ze uses the median, DIC uses the mean of the same 50% central range of depth information.
Western geophysicists owe their widely-used concept of Normalized Depth of Investigation Characteristic (NDIC) principally to the published works of Roy and Apparao.
Oldenburg, D.W. and Y. Li, 1994. Inversion of induced polarization data: Geophysics, v. 59, p 1327-1341.
Shore's notes: This describes the basis of E-SCAN's true 3D IP survey processing method.
Legault, J.M., Carriere, D. and L. Petrie, 2007.
Synthetic model testing and Titan-24 DC resistivity results over an Athabasca-type unconformity Uranium target at Wheeler River,
Athabasca Basin, Northwestern Saskatchewan: KEGS/Exploration 07 Geophysics Workshop.
Szybinski, A. and G. Shore, 2006.
Preliminary geological and geophysical characteristics of the Pumpernickel Valley Geothermal System:
Proceedings, Thirty-First Workshop on Geothermal Reservoir Engineering Stanford University, Stanford, California, January 30-February 1, 2006
Bibby, H.M. G.F. Risk, T.G. Caldwell, and S.L. Bennie, 2005. Misinterpretation of electrical resistivity data in geothermal prospecting: a case study
from the Taupo Volcanic Zone: Proceedings World Geothermal Congress 2005, Antalya, Turkey, 24-29 April 2005
Abstract:
Perhaps the most successful application of electrical resistivity techniques for delineating geothermal systems has been in the early exploration
of the Taupo Volcanic Zone of New Zealand. Systematic mapping using the Schlumberger resistivity arrays with fixed spacings has identified 23
individual geothermal systems with well-defined boundaries. The remarkable success of the method in the Taupo Volcanic Zone is linked to the
very thick (500+ metres) cover of young (less than 500 Ka), highly resistive, pyroclastic material that forms the upper layers of the region.
However, the success has resulted in a lack of care with interpretation based on the belief that resistivity data can be simply interpreted using
the apparent one-to-one correlation between low resistivity and the presence of geothermal fluids. The first example of misinterpretation of electrical
data in the Taupo Volcanic Zone was the Horohoro (Matahana) prospect where a deep low resistivity layer was drilled for geothermal fluids in 1987
despite warnings of possible misinterpretation. This well was cold and the cause of the low resistivity has now been established as old ignimbrite layers (over 1 Ma)
which have undergone low-temperature diagenetic alteration to form highly conductive, connected clay paths within the rock matrix.
The older, conductive ignimbrites are extensive and continuous around the edges of the TVZ where they are underlain by resistive basement rocks.
Within the TVZ, structural investigations using magnetotelluric show these conductors to be present at depth beneath much of the area.
We outline here both the history and the lessons of the past, in the hope that they will provide guidance for future geothermal explorations.
Anderson, Errol, Daryl Crosby and Greg Ussher, 2000. BULLS-EYE! - Simple resistivity imaging to reliably locate the geothermal reservoir:
Proceedings World Geothermal Congress 2000 Kyushu-Tohoku, Japan, May 28-June 10, 2000
Abstract:
This paper presents interpretations of MT surveys from a number of geothermal fields in steep terrain, where the geophysical interpretation
can be constrained by data from deep exploration or production wells. One particular anomaly, namely the shape of the base of the conductive
layer overlying the high-temperature geothermal reservoir, strongly correlates with well temperatures and even well productivity.
The proposed interpretation method is simple and does not require particularly sophisticated analysis techniques or computing power.
It does not even require particularly high-quality MT measurements, and has given good results with 10-year old data.
As long as the initial survey is well-designed and executed, the method gives a clear "bulls-eye" target that reliably locates the geothermal reservoir.
Definitions, annotated glossary, illustrations and examples not started
SECTION NOT STARTED: WILL BE LATE IN THE SITE DEVEOPMENT SCHEDULE
Definition of
true 3D field data sets.
[edit] Definitions
DEFINITION: resistivity http://en.wikipedia.org/wiki/Resistivity
Electrical resistivity (also known as resistivity, specific electrical resistance, or volume resistivity) is a measure of how strongly a material
opposes the flow of electric current.
A low resistivity indicates a material that readily allows the movement of electric charge.
The SI unit of electrical resistivity is the ohm metre [Ωm]. It is commonly represented by the Greek letter ρ (rho).
Electrical conductivity or specific conductance is the reciprocal quantity, and measures a material's ability to conduct an electric current.
It is commonly represented by the Greek letter σ, but κ (esp. in electrical engineering) or γ are also occasionally used.
Its SI unit is siemens per metre (S·m−1) and CGSE unit is inverse second (s−1):
\sigma = {1\over\rho}.
A piece of resistive material with electrical contacts on both ends.
Electrical resistivity ρ (Greek: rho) is defined by,
\rho={E \over J} \,\!
where
ρ is the static resistivity (measured in ohm-metres, Ω-m)
E is the magnitude of the electric field (measured in volts per metre, V/m);
J is the magnitude of the current density (measured in amperes per square metre, A/m²).
Many resistors and conductors have a uniform cross section with a uniform flow of electric current and are made of one material.
(See the diagram to the right.) In this case, the above definition of ρ leads to:
\rho = R \frac{A}{\ell}, \,\!
where
R is the electrical resistance of a uniform specimen of the material (measured in ohms, Ω)
\ell is the length of the piece of material (measured in metres, m)
A is the cross-sectional area of the specimen (measured in square metres, m²).
[edit] Explanation
The reason resistivity has the dimension units of ohm-metres can be seen by transposing the definition to make resistance the subject:
R = \rho \frac{\ell}{A} \,\!
The resistance of a given sample will increase with the length, but decrease with greater cross-sectional area. Resistance is measured in ohms.
Length over area has units of 1/distance. To end up with ohms, resistivity must be in the units of "ohms × distance" (SI ohm-metre, US ohm-inch).
In a hydraulic analogy, increasing the diameter of a pipe reduces its resistance to flow, and increasing the length increases resistance to flow
(and pressure drop for a given flow).
This project would have been easier on crew and equipment if it had started as
planned in January, instead of in August's maximum heat.
Time: Completed on schedule.
Cost: Fixed budget, no additional charges allowed.
Risk to client: Zero. All risks to contractor.

The use of reduced-information derivative values to constrain 3D inversion model development is a significant disadvantage, proportional to the number of
derivatives involved in each datum... dipole-dipole data are second-order derivatives, remember?
It is useful to reinforce the fact that the fundamental pole-pole data are
individually more effective in guiding (forcing) the developing 3D earth model inversion.
A compounding of this advantage occurs when the pole-pole array data set steps out from its conventional along-the-line survey arrangement and through E-SCAN
technology measures cross-line, and diagonally, in fact everywhere, at every station on the property-wide grid setup. A few hundred one-directional data become
thousands of all-directional, dense and uniformly sampled data, quite a different set of conditions to be matched by any 3D model inversion processing.
Conventional surveys deliver a single strip of gradients (voltage differences, as n=1 to 7 or n=1 to 10) always in one direction, radially outward from
the centre of the potential field. For the same potential field, established by current injection at the same grid station, 3D E-SCAN technology allows
measurement (not of gradients, but) absolute voltages at all of the grid stations surrounding the injection point, effectively mapping and defining the
nature of the entire potential field as it surrounds the current injection point.
The information/data difference is immense. The multi-directional E-SCAN pole-pole data set would allow calculation of equivalent strips of dipole data
that could be plotted radially outward in all directions from the current station,- the effective equivalent of having run four or eight separate,
complete dipole surveys of the property, in varying survey line orientations. But with the advantage of not having derivative (dipole) data, but
full-information, maximum-depth fundamental pole-pole data.
Effect on interpretation: The inversion process repeatedly (every iteration, for 20, 30, maybe 100 iterations) solves for a surface potential
field (2D field of voltages) which it then compares to the observed field data, to see how close it is getting to reproducing a 3D resistivity model
that could cause what we saw at surface in the field survey results. When the algorithm compares it's model-development progress to conventional
pole-dipole or dipole-dipole field data (the sequence or strip of gradients or differences in a line out from the current site), it selects the few
absolute voltage values that it needs to calculate derivatives (gradients, differences) that are equivalent in location to those we measured in the field.
So with derivative data, one (or a few) sequence of gradients (not even absolute values) is the basis of comparison to see how the latest inversion model
is doing in matching the field data. Because the field data are derivatives, the the matching can be done only after the computed model voltages field
have been calculated (degraded) into equivalent derivatives (gradients, differences) for comparison. How inefficient,- and remember that the data we are
trying to match are the dipole-dipole or the pole-pole measured values, when we could be comparing, matching and adjusting the model each iteration with
the actual fundamental potential field voltages. Efficiency aside, which model will be most objective, most comprehensively constrained... one matching
256 short strips of one-direction voltage differences, or one matching 256 complete, area-wide absolute-voltage-mapped potential fields?
The example pictured here shows the best-alternative conventional data set (pole-dipole), and the 3D E-SCAN data set.
Absolute voltages, all relative to a the
same single remote point of reference.
The term "derivative" is used loosely here to describe a real and precise effect.
A "difference" field or a "difference" voltage (potential difference) would also suffice, perhaps more accurately.
ut this is not intended to be a working mathematical characterization,- just an easily repeatable reminder of the consequences of electrode positioning in a survey:
the loss of signal strength and information by the subtraction or cancellation of primary or "fundamental" values... leaving a difference or, loosely, a derivative.
Summary: Avoiding using a measurement dipole avoids signal cancellation, thus allowing maximum-signal (maximum information) measurements.
When the four-electrode measurement setup involves two dipoles, the current dipole delivers a subtracted net field - the first derivative -
that is left over after a negative field is overlapped onto a positive field, from which a second dipole measures a voltage difference -
effectively a derivative of a derivative, or, a second order derivative.
For our purposes: Derivatives mean reduced information,- subtracted remainders of fundamental information. Fewer is best.
The dipole-dipole array uses two; the pole-dipole array uses one; the pole-pole array uses none.
Each pole-dipole measurement contains more information than the dipole-dipole array, covering a
greater vertical sampling interval with higher signal resulting from a simpler stimulation patterns - a single current point potential field
that is not decimated by a nearby opposite-polarity field. The dipole-dipole measurement is actually a derivative of these two pole-dipole
measurements - one can calculate the dipole-dipole plotted value by subtracting the first pole-dipole measurement from the second, effectively
subtracting what happens due to one current injection from what happens due to another.... which is precisely what is going on when the
measurement is made in the dipole-dipole setup. Much of the deeper pole-dipole information, and a lot its signal strength, is subtracted away,
leaving the smaller signal plotted at a shallower depth. This is another way of showing that there is more "information" in each of the
pole-dipole measurements, representing what's going on across the deeper and wider sample interval (the 50% bar).
When it comes to inversion modeling processing, far better to have two separate deeper-information data to work on, to accommodate in the developing model,
than just the single dipole-dipole derivative value.
The dismal operating economics of conventional pole-pole surveys are completely overcome with 3D E-SCAN's
high degree of automation of field processes. This enables E-SCAN to acquire a 15,000 datum field measurement set in 10 days, as compared to the four
years (at 7 days per week) required to obtain the same data with conventional pole-pole array operations. Conventional pole-pole survey is not only
difficult to set up initially, but it is also time consuming to to reposition the additional long wire needed for every measurement.
Up to 2000 watts of transmitter capability can be backpacked along survey lines to get the full benefit of the dipole-dipole array's operating efficiencies. This includes many battery powered units, and backpack motor-generator-powered transmitter systems (Phoenix Geophysics, formerly McPhar) up to 1.5, even 2 kilowatts. Once the required power levels exceed this level, stationary transmitters are
used with pole-dipole arrays. Motor-generators powered systems (Walcer-Huntec, Scintrex, Zonge, others) providing up to 20 kilowatts (20,000 watts)
of power may be employed. The 35+ kilowatt systems (Anaconda, Asarco, Premier, various USSR entities), most originating from the porphyry copper
boom days many decades ago, are today mostly irrelevant, strongly outperformed in every aspect by 3D E-SCAN.
Edwards*, L.S. 1977. A MODIFIED PSEUDOSECTION FOR RESISTIVITY AND IP: Geophysics 42, 1020 (August 1977)
*U.N. Development Program, Rangoon, Burma
ABSTRACT: Dipole-dipole induced-polarization measurements are commonly presented as pseudosections, but results using different dipole lengths
cannot be combined into a single pseudosection. By considering the theoretical results for simple earth models, a unique set of relative depth
coefficients is empirically derived, such that measurements with different array parameters will "mesh" smoothly into a combined pseudosection.
Application of these coefficients to a number of theoretical and field cases shows that they give reasonable results when applied to more complicated models.
The empirical coefficients are compared with Roy's theory of "depth of investigation characteristic," and support that theory, if a modified
definition of "effective depth" is accepted. This leads to an absolute depth scale for the modified pseudosection. It is shown that rough estimates
of the depth to the top of an anomalous body can be made directly on the pseudosection, at true vertical scale. This definition of effective depth
is applied to other electrode arrays. It is shown, by examples, that the resulting pseudosections give consistent estimates of depth to top,
within the characteristic anomaly patterns of each array. The effective depths for various arrays are compared; the results agree with the
traditional applications of each array.
For all arrays, the nominal depth of investigation, or effective penetration, is proportional to
the distance separating the current input electrode(s) from the measurement electrode(s). Wider spread = deeper sampling.
The other current electrode has been positioned at the remote "infinite" location where
it would remain for the duration of a pole-dipole survey.
Not to dismiss the fact that some normally arid areas may be surveyed most cost-effectively in the good weather immediately following
the rainy season, when the ground is still damp near surface, providing easy electrode contacts.
With 3D E-SCAN's almost two-orders signal advantages, up to 100 times less current is needed for
measurements, compared to a dipole-dipole survey. This means that transmitter voltage levels will be proportionally lower.
What may have required 3000 volts for a conventional survey may only need 150 volts for E-SCAN, greatly reducing possibilities of current leakage in wet conditions.
Transmitted voltages in wet conditions can be deliberately lowered even further if desired, by stacking signal a little longer,- a
keyboard option that can be invoked at any time.
If conventional geophysics is "a bunch of things trying to go wrong at the same time", imagine 3D E-SCAN.
That's why any normal deployment of an E-SCAN system includes many special supplies intended to avert or quickly fix the many things that can come up on a "normal" day.
For example, we don't count on line-of-sight radio contact,- we always bring a repeater station and the means to power it up in any location.
We can't count on not finding wire-eating animals in an area, so we always bring a variety of supplies and devices so that, for example,
where bite damage is repeatedly occurring, we can elevate (or re-route) the wire and avoid the next bite from the rabbit that claims that 50 metre
stretch of desert as his own, every night. Armored cable, for road crossings where there are no trees to go up and over, and no culverts to go under.
We don't know when we will encounter an unexpected obstacle, so we bring wire flinging tools and supplies, and enough wire to re-route around.
Sometimes a 250 gram lead fishing weight in your cruiser vest is the only thing keeping you from losing 15 minutes searching for a decent throwing rock.
Extra batteries, and backups for every key instrument, ATV, radio, GPS and generator. Not ten rolls of tape,- 200.
Once we start, with all that wire spread out, we don't want to stop for anything, least of all to make a 100 mile drive to Wal-Mart for something
we didn't bring, and know we should have, (only to find that Wal-Mart is sold out).
In rainy conditions, there may be no alternative other than to replace entire sections of wire that defy quick diagnosis and repair... the cost of replacement
is often much less than the cost of delays in trying to detect a small insulation breach in a long wire. Having spare wire at the survey site is essential.
"A few hundred pounds of prevention... "
For all its complexity, 3D E-SCAN maintains an astonishingly high historical record of productive "up-time" in the field.
This survey was done under a daily rate contract... slower
progress cost the client more, as did the need for two
extra crew members to minimize rain repair delays.
Time and cost: probably 30% higher than would have
been the case in the drier summer.
Risk to client: Some... in any intensively farmed
areas there are many uncontrollable variables that
affect the wiring system, especially with rain.
Premier Geophysics welcomes your questions and discussion on all technical issues of concern.
Transmitter-delivered current is digitized and recorded over exactly the same integration intervals as the measured signal. This means that if current
pulses are irregularly tapering off due to arc-caused heating, the measured voltage remains in perfect correlation (for every pulse) so that the stacked
signal/current ratio remains free of error.
Result: Normal high-quality field data, from difficult current-injection conditions, with no extra demands on the field system operator.
Innovations like this don't come from "lab-coat" engineers.
E-SCAN's system designers bring over 75 years of hands-on field experience in low-power and high-power DC resistivity (and IP) to every aspect of instrument design.
Applying an ohm-meter (like the one on the front panel of most commercial IP/resistivity receivers)
to an electrode in poor contact conditions may show an "acceptable" resistance (under the 1.5 to 6 volts DC stimulation) that is not present when ordinary millivolt
(1/1000 volt) level signal is present. This leads to possibly strongly-attenuated data being accepted as valid, introducing false conductive values.
Further, application of such high voltages (1.5 to 6 volts DC) often upsets the electrode-earth contact dynamics, setting up a signal-swamping electro-chemical voltage offset
that may take minutes to settle out before a measurement can take place. That will slow survey progress.
Frequent settling delays caused by too-high applied voltages tends to inhibit the routine use of contact testing
by a production-driven operator, exposing a risk that attenuated (falsely conductive) measurement data may be acquired, unnoticed.
Employing hundreds of automated electrodes demands systems that can routinely verify contact resistance quality, preferably without causing delays,
and certainly without introducing new sources of measurement error. E-SCAN measures contact resistance as it actually occurs at the millivolt signal level,
ensuring that any high-resistance signal attenuation is quantified and documented, and the means for data correction is preserved.
In the meantime, crew can be alerted to service a dried-out electrode (add some salt water) when convenient.
There is no other responsible way to manage a survey, using any number of electrodes,
in conditions of questionable electrode contact, i.e. in most hot/dry survey settings.
There are remaining limitations, just as with the X-ray CAT-scan.
To name one: the issue of discrimination of a "stack of pancakes" feature from a single anomaly of similar overall proportions.
Even E-SCAN can't help in this task.
With reasonable road access on both sides of the river, managing the wiring changes required by the river made little difference to time and costs.
Only occasionally would we have a dead-time while some crew had to move from one side of the river to the other - a total of 20 metres,
by driving around the long way for half an hour.
Time and cost: This project was a daily-rate contract.
Total survey time and costs were
increased by 10%, not more.
Risk to client: none.
... so that the station continues to occupy a position at a node on the 3D inversion
mesh that will be used later to process the 3D data, thereby eliminating entirely the post-processing adjustments that would be
needed for a randomly-offset position.
Note the small white square denoting the actual size of the eventual 3D mesh elements.
The small grey circle shows originally proposed grid station.
Each crew member's GPS has pre-programmed positions for every possible 1/4 offset, i.e. every 3D mesh node.
If the suggested electrode offset as shown in this layout map can not be reached, another alternate can be
called up on the GPS and an attempt can be made to wire to that point.
While air photos are wonderful, it's the boots on the ground that tell the final story.
Especially in bad weather conditions, we need to keep things simple, and waste no time.
Beyond throwing distance, a slingshot with fishing line could be used to pull a heavier wire across.
A potato gun proved effective for a couple of areas where we couldn't even get close to the river due to thick brambles and treacherous slopes.
The need for such crossings is minimized by being able to wire entire sub-areas on the other side from just one crossing.
A locally-hired skiff was used by one crew person with a
handheld GPS to locate and install the 18 in-river electrodes,
taking up about a half-day.
Time: negligible
Cost: no additional charges to client
Risk to client: none.
3D E-SCAN has not yet been deployed on this type of survey.
This is a plan for a high-speed, several-per-week helicopter-
supported program for the comprehensive evaluation of 10 to
200 AeroMagnetics or Airborne EM anomalies.
Time: Several sites per week with a crack crew.
Cost: To be determined.
Risk to client: Probably a per-day, best-efforts operation first time out.
Fixed pricing could also be calculated, helicopter at cost.
This project was planned as a partly-lake survey, well in advance.
Time: Faster than a summer open-water survey; as fast as
the best open-terrain ATV project.
Cost: No extra charges.
Risk to client: None. Fixed price guaranteed, including mine camp room and board.
This project was obviously planned as a partly-lake survey, well in advance.
Time: Between no ATV's (all on foot, helicopter setouts) and
large water areas, twice the time normally needed.
Cost: About 50% premium for conditions.
Risk to client: Minimal. Helicopters already in the area for drilling.
Fixed price guaranteed, but camp and helicopter at client expense.
When an expanded-spacing test of 300 foot grid data such as this is done, it actually involves four
separate inversions using four separate and distinct data subsets. Using a nominal grid starting point, the first data subset is comprised of
data that correspond to grid points located on 600 foot intervals on both X and Y axes. Then the origin-point is moved 300 feet in the X axis,
and a completely different 600 foot data subset is sorted and filed. The origin-point is now moved 300 feet in the Y axis, for the third unique
data subset. Finally, the origin-point is moved back 300 feet on the X axis to generate the fourth unique 600 foot data subset.
The point of this is to establish empirically, using the actual field measurements, that regardless of where a 600 foot spacing grid is started,
the 3D inversion model results will be the same. In this case, they were the same, confirming that 600 foot data would do the job effectively and
without missing any important details. If the four 600-foot data subset models had disagreed, this would show that 600 feet was too coarse a grid
for the area, and that the wider-spaced (much lower cost) surveys were inappropriate for use.
In a similar setting, 300 foot grid data
for Paradise Peak were reprocessed as multiple 600 foot data subsets and 900 foot data subsets, all of which clearly and unambiguously mapped the
three main mineralized zones. In the 900 foot data subsets, the subtle altered/mineralized areas (anomalous yellow in the 300-foot model) were not revealed.
Decisions regarding district-scale survey dimensions would take that deficiency into account, perhaps settling on 600 foot grid spacing as the
proven-effective, all-details-included grid spacing, or perhaps foregoing such detail in the interest of getting 40% greater area coverage for the same cost.
With commercial accommodation nearby, this became a routine 3D E-SCAN survey, very fast in and out.
Completion on-time, on-budget.
Time: as predicted.
Cost: Fixed budget, no additional charges allowed.
Risk to client: Zero. All terrain risks to contractor.
For this debut 3D E-SCAN survey, extra time was budgeted for instrument calibrations, and some operating experiments.
Dependence on daily helicopter lifts turned out to be over-estimated,- much of the survey layout and shooting
was done entirely on foot, operating from the alpine camp.
Time: as predicted.
Cost: Fixed budget, no additional charges allowed.
Risk to client: ...who knew? First survey ever.
No significant issues, no cost over-run.
Major funding/innovation contributors to the 12-year Premier Geophysics
"extreme terrain mapper" (E-SCAN) research and development:
- the Geological Survey of Canada (GSC),
- the British Columbia Hydro and Power Authority (BCHPA),
- the British Columbia Department of Energy, Mines and Petroleum Resources,
- project managers for GSC and BCHPA - Nevin Sadlier-Brown Goodbrand Ltd. (NSBG)
- the Natural Sciences and Engineering Research Council of Canada (NSERC) with
- the University of British Columbia, Department of Geophysics and Astronomy (UBC).
Key individual acknowledgments - Dr. Andrew Nevin (NSBG), Dr. Jack Souther (GSC),
Josef Stauder (BCHPA), Dr. Douglas Oldenburg (UBC), Dr. Robert Ellis.
In the raw data image, the longer purple tics signify very conductive conditions,
typical of the geothermal system already known in the area of the tics. Even in a single all-depths raw-data compilation plot
like this, you can see a clear limit to the strong conductivity zone, at least two kilometres short of reaching the area (to
the right) where road-building would be possible without extensive bridge construction. The issue had remained open due to
the presence of normally-promising indications such as hot fumaroles and a hot drillhole (A-1, the black dot just below the
word "bluffs") in the road-accessible area to the east. E-SCAN provided subsurface definition of permeability conditions
in this area, reporting disappointing conditions. Favorable results would have looked like the area at the upper left...
a dense area of long red tics, indicating low resistivity (high permeability) to go along with the high observed temperatures.
This project was planned from a desk in San Francisco using maps and the client's description of site conditions.
The project was a fixed-price contract, and was finished on time, on budget,
and without excessive helicopter time.
Time: as predicted.
Cost: Fixed contract, no additional charges allowed.
Risk to client: none except possibility of helicopter cost overruns.
Edwards, L.S., 1977, A modified pseudosection for resistivity and IP: GEOPHYSICS, v. 42, p. 1020-1036.
See also: Roy, A., and Apparao, A., 1971, Depth of investigation in direct current methods: GEOPHYSICS, v. 36, p. 943-959.
Surveying the property with the pole-dipole array would supply only a small number of additional discrete data,
but each pole-dipole datum contains more and deeper information than a dipole-dipole datum, helping to force the inversion algorithm to define a somewhat sharper,
definitely deeper, and probably less-ambiguous earth model.
Note that this effective penetration varies when resistivity variables are present, as in cases such as suggested
by the geologic outline behind.
Sparseness of observed data sets (and the limited directional information content of data sets) remain the key
limiting issue in the EM methods. In any geo-electric earth modeling, the absence of sufficient hard data measurements with which to constrain and force
the existing, competent inversion algorithms to resolve a low-ambiguity earth model constitutes a very serious limitation.
The value of inversions based on sparse, uni-directional field data such as these is strongly challenged within this website.
The paper refers to a geothermal exploration technique for circum-traversing volcanic edifices, seeking conductive
anomalies only. Resistive epithermal gold orebodies lying along the route would probably not be detected, for all of the reasons elaborated and demonstrated on this website.
More than half of this website deals with demonstrating and proving this game-changing concept - that resistive
targets in general have remained essentially undetectable by electrical resistivity survey tools, without any concurrent warning of the technical deficiency.
Anomalies simply would not appear, while survey results looked competent, normal. We know that there has been some progress made in this area, but none of
it comes even close to the performance demonstrated by 3D E-SCAN. Significance: most of the world's volcanic-hosted epithermal gold deposits will fall
into this previously undetectable resistive-signature category. Implications are big, for finding additional orebodies of this type, under cover, where
other exploration indicators are absent.
Which indeed they did... using the accepted state-of-art instruments and practices of the day.
Only now we can see that those tools were deficient in several significant areas, so that only a narrow range of simple target geometries were
actually reliably recognizable, with effectively no recognition of buried resistive targets at all.
 The use of reduced-information derivative values to constrain 3D inversion model development is a significant disadvantage, proportional to the number of
derivatives involved in each datum... dipole-dipole data are second-order derivatives, remember?


